

Corak sebenar

Triple Bottom
was formed on 26.03 at 07:00:22 (UTC+0)
signal strength 3 of 5
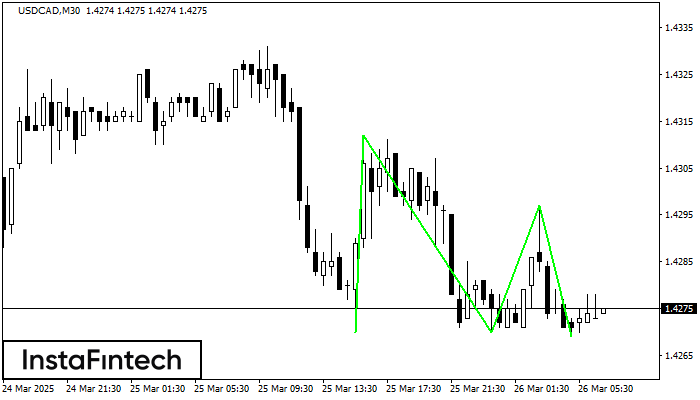
The Triple Bottom pattern has formed on the chart of USDCAD M30. Features of the pattern: The lower line of the pattern has coordinates 1.4312 with the upper limit 1.4312/1.4297, the projection of the width is 42 points. The formation of the Triple Bottom pattern most likely indicates a change in the trend from downward to upward. This means that in the event of a breakdown of the resistance level 1.4270, the price is most likely to continue the upward movement.
Juga lihat
- All
- All
- Bearish Rectangle
- Bearish Symmetrical Triangle
- Bearish Symmetrical Triangle
- Bullish Rectangle
- Double Top
- Double Top
- Triple Bottom
- Triple Bottom
- Triple Top
- Triple Top
- All
- All
- Buy
- Sale
- All
- 1
- 2
- 3
- 4
- 5
Segi Tiga Simetri Menurun
was formed on 06.04 at 09:00:08 (UTC+0)
signal strength 4 of 5

Berdasarkan carta H1, #Bitcoin membentuk corak Segi Tiga Simetri Menurun. Penerangan: Sempadan yang lebih rendah ialah 81178.46/83101.84 dan sempadan atas adalah 85102.23/83101.84. Lebar corak diukur pada carta pada -392377 pips
Open chart in a new window
Segi Tiga Simetri Menaik
was formed on 05.04 at 06:31:21 (UTC+0)
signal strength 2 of 5

Berdasarkan carta M15, #Bitcoin membentuk corak Segi Tiga Simetri Menaik. Sempadan yang lebih rendah bagi corak yang menyentuh koordinat 83167.44/83888.94 di mana sempadan atas merentasi 84422.11/83888.94. Sekiranya corak Segi Tiga
Carta masa M5 dan M15 mungkin mempunyai lebih banyak titik kemasukan palsu.
Open chart in a new window
Segi Empat Menurun
was formed on 05.04 at 02:40:31 (UTC+0)
signal strength 4 of 5

Berdasarkan carta H1, #Bitcoin telah membentuk Segi Empat Menurun. Jenis corak ini menunjukkan kesinambungan aliran. Ia terdiri daripada dua tahap: rintangan 84685.39 - 0.00 dan sokongan 81178.46 – 81178.46. Sekiranya
Open chart in a new window


