

Corak sebenar

Head and Shoulders
was formed on 25.03 at 04:50:35 (UTC+0)
signal strength 1 of 5

The technical pattern called Head and Shoulders has appeared on the chart of AUDJPY M5. There are weighty reasons to suggest that the price will surpass the Neckline 94.62/94.62 after the right shoulder has been formed. So, the trend is set to change with the price heading for 94.47.
The M5 and M15 time frames may have more false entry points.
- All
- All
- Bearish Rectangle
- Bearish Symmetrical Triangle
- Bearish Symmetrical Triangle
- Bullish Rectangle
- Double Top
- Double Top
- Triple Bottom
- Triple Bottom
- Triple Top
- Triple Top
- All
- All
- Buy
- Sale
- All
- 1
- 2
- 3
- 4
- 5
Bawah Triple
was formed on 05.05 at 15:34:54 (UTC+0)
signal strength 1 of 5
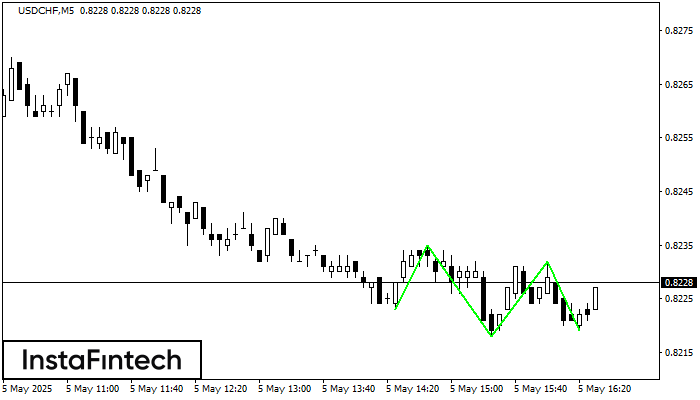
Pola Bawah Triple telah terbentuk pada USDCHF M5. Pola tersebut memiliki karakteristik sebagai berikut: level resistance 0.8235/0.8232; level support 0.8223/0.8219; dengan lebar 12 poin. Jika terjadi pemecahan (breakdown) pada level
Rangka waktu M5 dan M15 mungkin memiliki lebih dari titik entri yang keliru.
Open chart in a new window
Panji Bearish
was formed on 05.05 at 15:32:00 (UTC+0)
signal strength 3 of 5
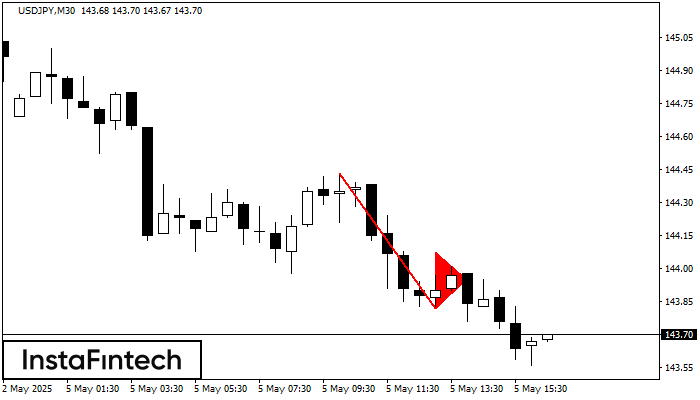
Pola Panji Bearish telah terbentuk di grafik Panji Bearish. Pola ini memberikan sinyal kelanjutan tren menurun jika titik terendah panji, di 143.82 ditembus. Rekomendasi: Tempatkan sell stop pending order
Open chart in a new window
Teratas Ganda
was formed on 05.05 at 14:24:52 (UTC+0)
signal strength 1 of 5
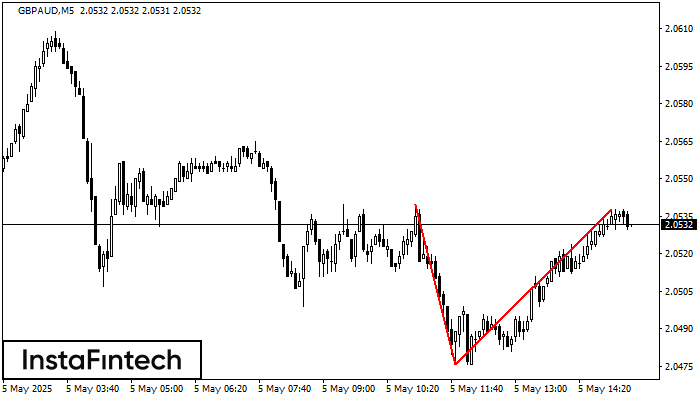
Pada grafik GBPAUD M5 pola reversal Teratas Ganda telah terbentuk. Karakteristik: batas atas 2.0538; batas bawah 2.0476; lebar pola 62 poin. Sinyal: tembusan ke batas bawah akan menyebabkan kelanjutan tren
Rangka waktu M5 dan M15 mungkin memiliki lebih dari titik entri yang keliru.
Open chart in a new window


