

Corak sebenar

Bullish Symmetrical Triangle
was formed on 24.03 at 23:00:22 (UTC+0)
signal strength 1 of 5
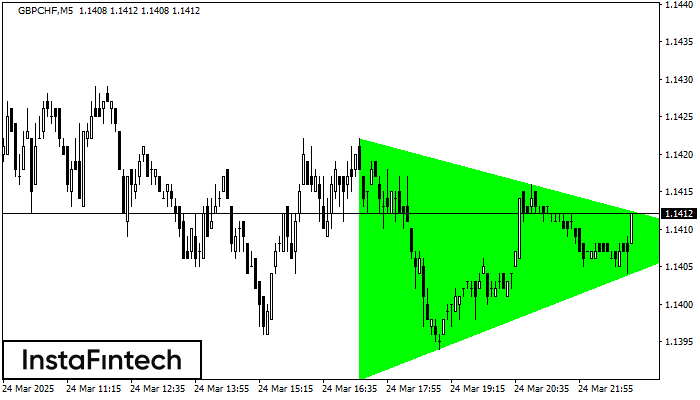
According to the chart of M5, GBPCHF formed the Bullish Symmetrical Triangle pattern. Description: This is the pattern of a trend continuation. 1.1422 and 1.1390 are the coordinates of the upper and lower borders respectively. The pattern width is measured on the chart at 32 pips. Outlook: If the upper border 1.1422 is broken, the price is likely to continue its move by 1.1424.
The M5 and M15 time frames may have more false entry points.
- All
- All
- Bearish Rectangle
- Bearish Symmetrical Triangle
- Bearish Symmetrical Triangle
- Bullish Rectangle
- Double Top
- Double Top
- Triple Bottom
- Triple Bottom
- Triple Top
- Triple Top
- All
- All
- Buy
- Sale
- All
- 1
- 2
- 3
- 4
- 5
Bearish Rectangle
was formed on 09.05 at 14:23:00 (UTC+0)
signal strength 1 of 5
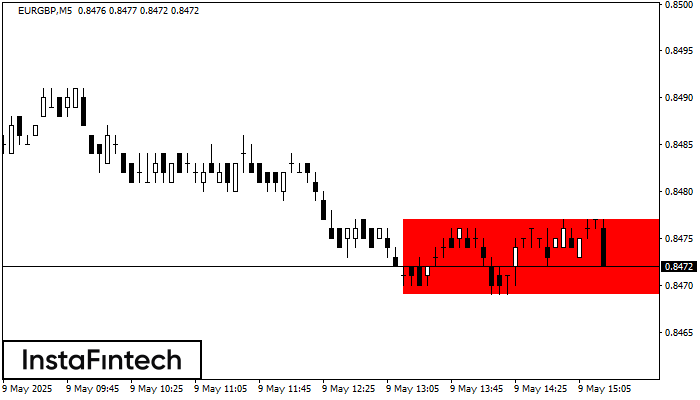
According to the chart of M5, EURGBP formed the Bearish Rectangle. This type of a pattern indicates a trend continuation. It consists of two levels: resistance 0.8477 - 0.0000
The M5 and M15 time frames may have more false entry points.
Open chart in a new window
Triple Bottom
was formed on 09.05 at 13:45:11 (UTC+0)
signal strength 2 of 5
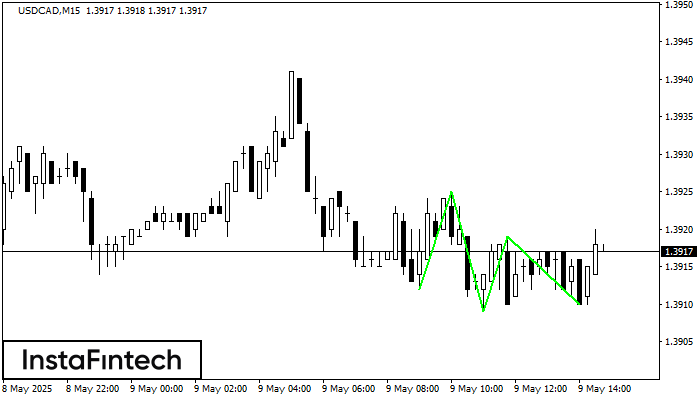
The Triple Bottom pattern has formed on the chart of USDCAD M15. Features of the pattern: The lower line of the pattern has coordinates 1.3925 with the upper limit 1.3925/1.3919
The M5 and M15 time frames may have more false entry points.
Open chart in a new window
Bullish Rectangle
was formed on 09.05 at 13:26:46 (UTC+0)
signal strength 3 of 5
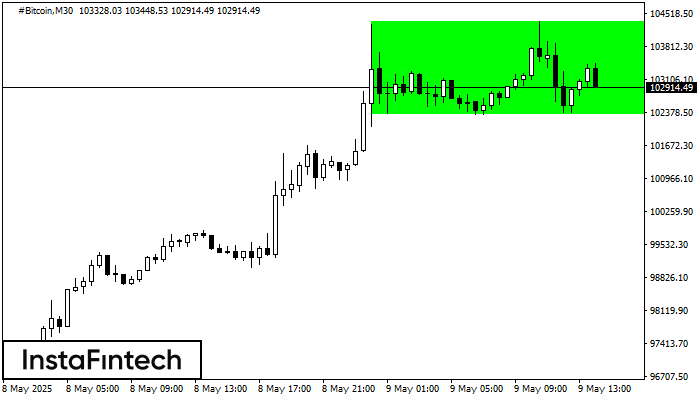
According to the chart of M30, #Bitcoin formed the Bullish Rectangle which is a pattern of a trend continuation. The pattern is contained within the following borders: the lower border
Open chart in a new window


