

Corak sebenar

Bearish Rectangle
was formed on 24.03 at 21:46:19 (UTC+0)
signal strength 2 of 5
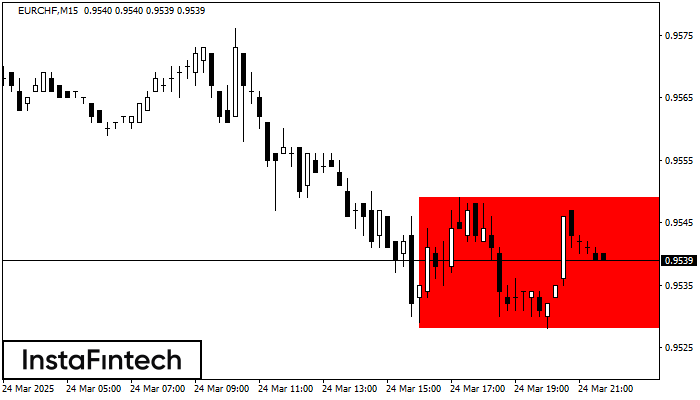
According to the chart of M15, EURCHF formed the Bearish Rectangle which is a pattern of a trend continuation. The pattern is contained within the following borders: lower border 0.9528 – 0.9528 and upper border 0.9549 – 0.9549. In case the lower border is broken, the instrument is likely to follow the downward trend.
The M5 and M15 time frames may have more false entry points.
- All
- All
- Bearish Rectangle
- Bearish Symmetrical Triangle
- Bearish Symmetrical Triangle
- Bullish Rectangle
- Double Top
- Double Top
- Triple Bottom
- Triple Bottom
- Triple Top
- Triple Top
- All
- All
- Buy
- Sale
- All
- 1
- 2
- 3
- 4
- 5
Double Bottom
was formed on 03.05 at 10:45:44 (UTC+0)
signal strength 2 of 5

Corak Double Bottom telah dibentuk pada #Bitcoin M15. Pembentukan ini menandakan pembalikan aliran dari aliran menurun ke atas. Isyarat ialah perdagangan membeli harus dibuka selepas sempadan atas corak 96350.17 telah
Carta masa M5 dan M15 mungkin mempunyai lebih banyak titik kemasukan palsu.
Open chart in a new window
Double Bottom
was formed on 03.05 at 08:00:01 (UTC+0)
signal strength 3 of 5

Corak Double Bottom telah dibentuk pada #Bitcoin M30; sempadan atas adalah 97860.25; sempadan bawah adalah 96258.44. Lebar corak adalah 156618 mata. Sekiranya penembusan sempadan atas 97860.25, perubahan aliran boleh diramalkan
Open chart in a new window
Double Bottom
was formed on 03.05 at 06:20:09 (UTC+0)
signal strength 1 of 5

Corak Double Bottom telah dibentuk pada #Bitcoin M5; sempadan atas adalah 96467.62; sempadan bawah adalah 96258.44. Lebar corak adalah 20692 mata. Sekiranya penembusan sempadan atas 96467.62, perubahan aliran boleh diramalkan
Carta masa M5 dan M15 mungkin mempunyai lebih banyak titik kemasukan palsu.
Open chart in a new window


