

Corak sebenar

Triple Bottom
was formed on 24.03 at 20:25:19 (UTC+0)
signal strength 1 of 5
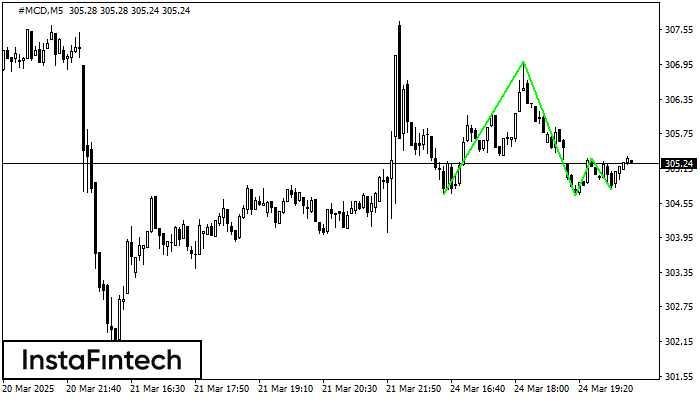
The Triple Bottom pattern has formed on the chart of the #MCD M5 trading instrument. The pattern signals a change in the trend from downwards to upwards in the case of breakdown of 307.00/305.33.
The M5 and M15 time frames may have more false entry points.
Juga lihat
- All
- All
- Bearish Rectangle
- Bearish Symmetrical Triangle
- Bearish Symmetrical Triangle
- Bullish Rectangle
- Double Top
- Double Top
- Triple Bottom
- Triple Bottom
- Triple Top
- Triple Top
- All
- All
- Buy
- Sale
- All
- 1
- 2
- 3
- 4
- 5
Bearish Symmetrical Triangle
was formed on 09.04 at 07:30:56 (UTC+0)
signal strength 1 of 5
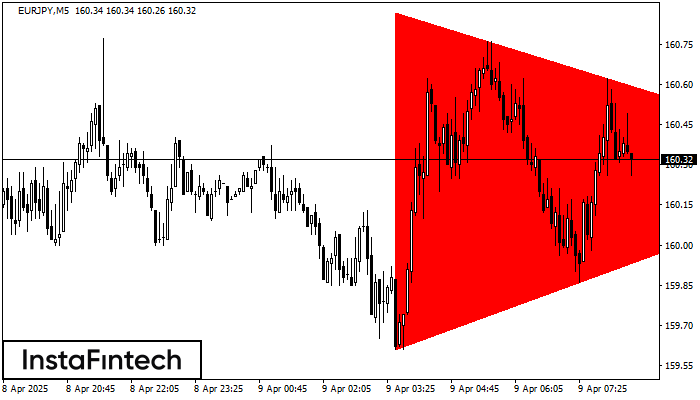
According to the chart of M5, EURJPY formed the Bearish Symmetrical Triangle pattern. This pattern signals a further downward trend in case the lower border 159.61 is breached. Here
The M5 and M15 time frames may have more false entry points.
Open chart in a new window
Bearish pennant
was formed on 09.04 at 07:17:26 (UTC+0)
signal strength 2 of 5
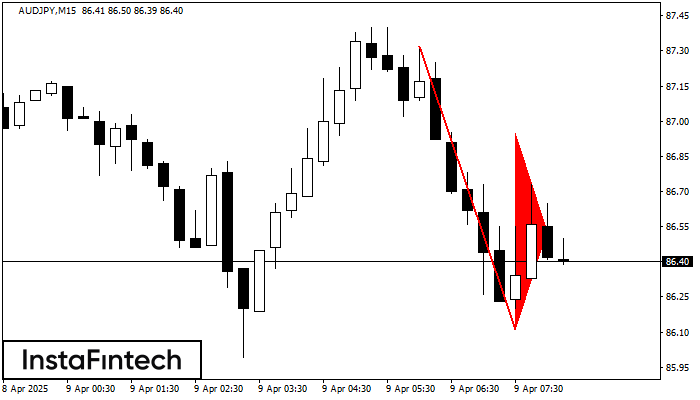
The Bearish pennant pattern has formed on the AUDJPY M15 chart. The pattern signals continuation of the downtrend in case the pennant’s low of 86.11 is broken through. Recommendations: Place
The M5 and M15 time frames may have more false entry points.
Open chart in a new window
Bullish Rectangle
was formed on 09.04 at 06:12:17 (UTC+0)
signal strength 1 of 5
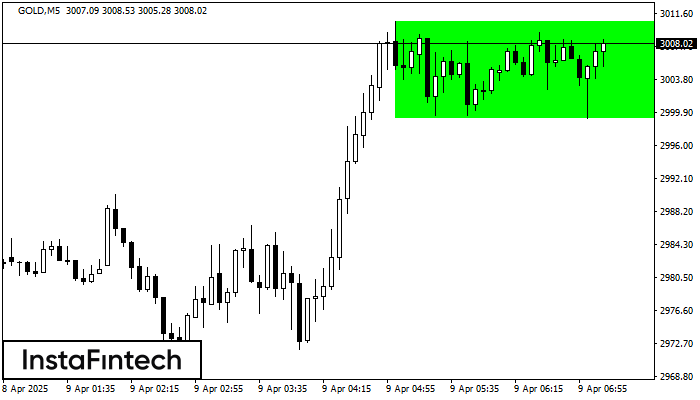
According to the chart of M5, GOLD formed the Bullish Rectangle. The pattern indicates a trend continuation. The upper border is 3010.63, the lower border is 2999.19. The signal means
The M5 and M15 time frames may have more false entry points.
Open chart in a new window


