

Corak sebenar

Bearish Rectangle
was formed on 21.03 at 15:02:37 (UTC+0)
signal strength 3 of 5
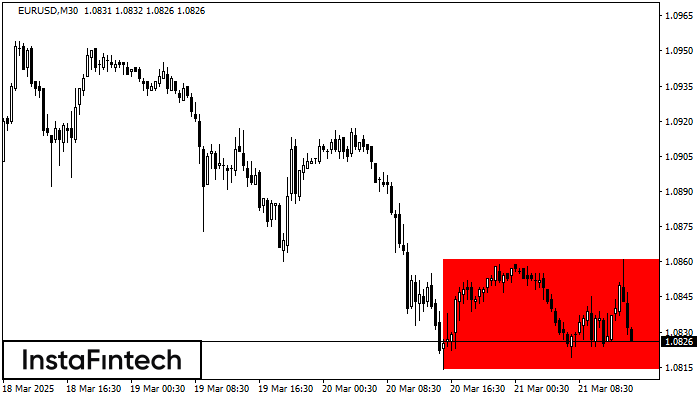
According to the chart of M30, EURUSD formed the Bearish Rectangle. The pattern indicates a trend continuation. The upper border is 1.0861, the lower border is 1.0814. The signal means that a short position should be opened after fixing a price below the lower border 1.0814 of the Bearish Rectangle.
- All
- All
- Bearish Rectangle
- Bearish Symmetrical Triangle
- Bearish Symmetrical Triangle
- Bullish Rectangle
- Double Top
- Double Top
- Triple Bottom
- Triple Bottom
- Triple Top
- Triple Top
- All
- All
- Buy
- Sale
- All
- 1
- 2
- 3
- 4
- 5
Медвежий симметричный треугольник
сформирован 04.05 в 09:04:31 (UTC+0)
сила сигнала 2 из 5

На графике #Bitcoin на M15 сформировалась фигура «Медвежий симметричный треугольник». Торговые рекомендации: Пробой нижней границы 95528.76 с большой долей вероятности приведет к продолжению нисходящего тренда
Таймфреймы М5 и М15 могут иметь больше ложных точек входа.
Открыть график инструмента в новом окне
Прямоугольник
сформирован 04.05 в 00:51:55 (UTC+0)
сила сигнала 3 из 5

По #Bitcoin M30 сформировалась фигура - «Прямоугольник». Фигура данного типа относится к тому типу продолжения тренда, который имеет два уровня: Сопротивление 96456.78; Поддержка 95805.26. В случае пробоя уровня поддержки 95805.26
Открыть график инструмента в новом окне
Двойное дно
сформирован 03.05 в 10:45:44 (UTC+0)
сила сигнала 2 из 5

Сформирована фигура «Двойное дно» на графике #Bitcoin M15. Данное формирование сигнализирует об изменении тенденции с нисходящего на восходящее движение. Сигнал: Торговую позицию на покупку следует открывать после пробоя верхней границы
Таймфреймы М5 и М15 могут иметь больше ложных точек входа.
Открыть график инструмента в новом окне


