

Corak sebenar

Bullish Symmetrical Triangle
was formed on 21.03 at 04:06:31 (UTC+0)
signal strength 1 of 5
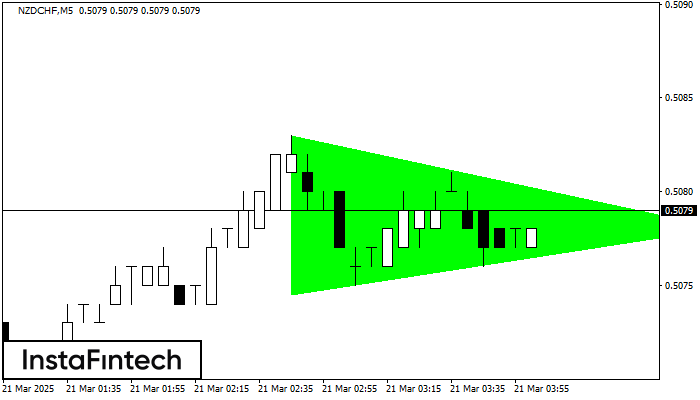
According to the chart of M5, NZDCHF formed the Bullish Symmetrical Triangle pattern. Description: This is the pattern of a trend continuation. 0.5083 and 0.5075 are the coordinates of the upper and lower borders respectively. The pattern width is measured on the chart at 8 pips. Outlook: If the upper border 0.5083 is broken, the price is likely to continue its move by 0.5093.
The M5 and M15 time frames may have more false entry points.
Juga lihat
- All
- All
- Bearish Rectangle
- Bearish Symmetrical Triangle
- Bearish Symmetrical Triangle
- Bullish Rectangle
- Double Top
- Double Top
- Triple Bottom
- Triple Bottom
- Triple Top
- Triple Top
- All
- All
- Buy
- Sale
- All
- 1
- 2
- 3
- 4
- 5
Segi Tiga Simetri Menaik
was formed on 05.05 at 05:57:59 (UTC+0)
signal strength 2 of 5
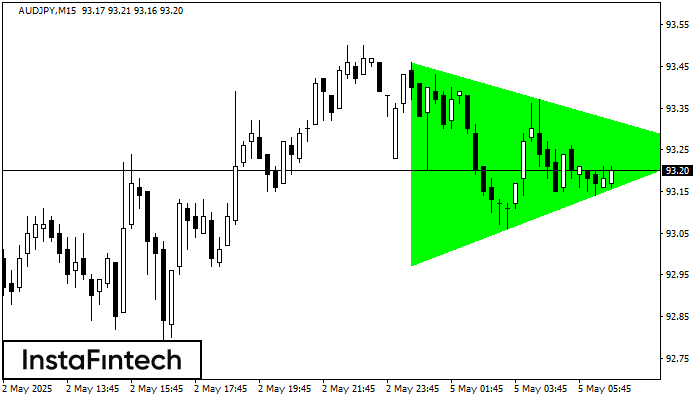
Berdasarkan carta M15, AUDJPY membentuk corak Segi Tiga Simetri Menaik. Sempadan yang lebih rendah bagi corak yang menyentuh koordinat 92.97/93.25 di mana sempadan atas merentasi 93.46/93.25. Sekiranya corak Segi Tiga
Carta masa M5 dan M15 mungkin mempunyai lebih banyak titik kemasukan palsu.
Open chart in a new window
Double Top
was formed on 05.05 at 05:10:19 (UTC+0)
signal strength 1 of 5

Corak Double Top telah dibentuk pada NZDJPY M5. Isyarat bahawa aliran telah berubah dari aliran menaik ke aliran menurun. Mungkin, sekiranya asas corak 86.15 ditembusi, pergerakan menurun akan berterusan
Carta masa M5 dan M15 mungkin mempunyai lebih banyak titik kemasukan palsu.
Open chart in a new window
Double Top
was formed on 05.05 at 04:15:20 (UTC+0)
signal strength 1 of 5
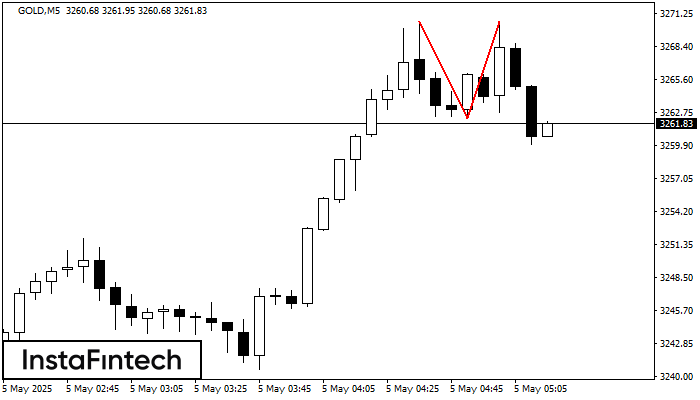
Corak Double Top telah dibentuk pada GOLD M5. Isyarat bahawa aliran telah berubah dari aliran menaik ke aliran menurun. Mungkin, sekiranya asas corak 3262.20 ditembusi, pergerakan menurun akan berterusan
Carta masa M5 dan M15 mungkin mempunyai lebih banyak titik kemasukan palsu.
Open chart in a new window


