

Corak sebenar

Inverse Head and Shoulder
was formed on 19.03 at 21:00:45 (UTC+0)
signal strength 3 of 5

According to M30, AUDCHF is shaping the technical pattern – the Inverse Head and Shoulder. In case the Neckline 0.5584/0.5578 is broken out, the instrument is likely to move toward 0.5608.
Juga lihat
- All
- All
- Bearish Rectangle
- Bearish Symmetrical Triangle
- Bearish Symmetrical Triangle
- Bullish Rectangle
- Double Top
- Double Top
- Triple Bottom
- Triple Bottom
- Triple Top
- Triple Top
- All
- All
- Buy
- Sale
- All
- 1
- 2
- 3
- 4
- 5
Double Bottom
was formed on 08.05 at 16:00:26 (UTC+0)
signal strength 4 of 5
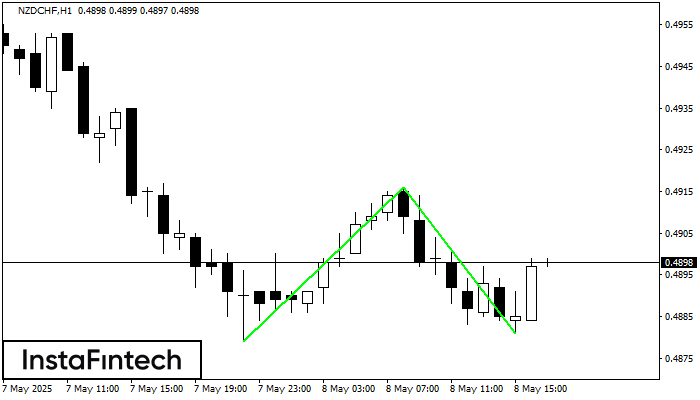
The Double Bottom pattern has been formed on NZDCHF H1. Characteristics: the support level 0.4879; the resistance level 0.4916; the width of the pattern 37 points. If the resistance level
Open chart in a new window
Bullish Symmetrical Triangle
was formed on 08.05 at 15:55:47 (UTC+0)
signal strength 1 of 5
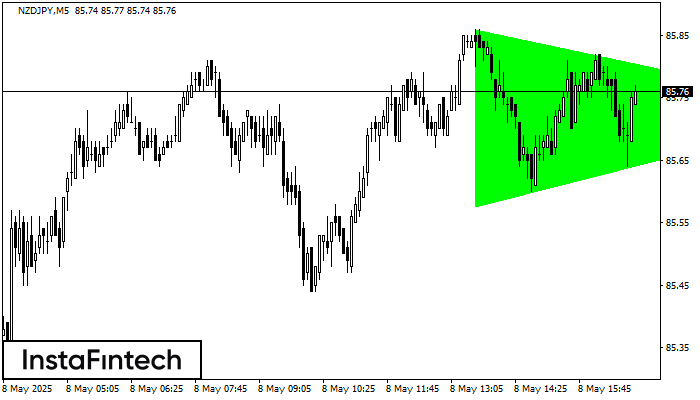
According to the chart of M5, NZDJPY formed the Bullish Symmetrical Triangle pattern. The lower border of the pattern touches the coordinates 85.58/85.73 whereas the upper border goes across 85.86/85.73
The M5 and M15 time frames may have more false entry points.
Open chart in a new window
Triple Bottom
was formed on 08.05 at 15:15:29 (UTC+0)
signal strength 2 of 5
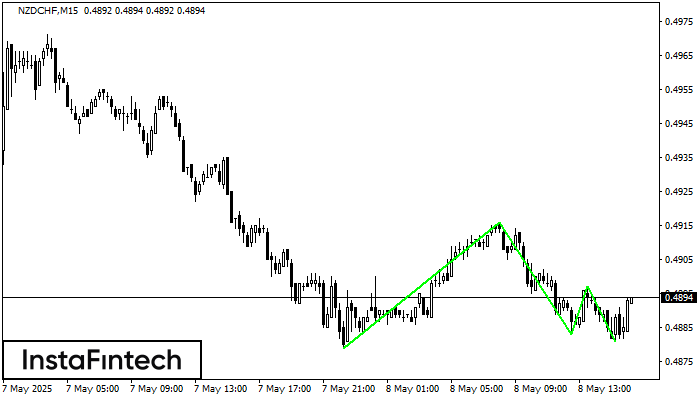
The Triple Bottom pattern has formed on the chart of the NZDCHF M15 trading instrument. The pattern signals a change in the trend from downwards to upwards in the case
The M5 and M15 time frames may have more false entry points.
Open chart in a new window


