Lihat juga


 26.02.2025 01:47 PM
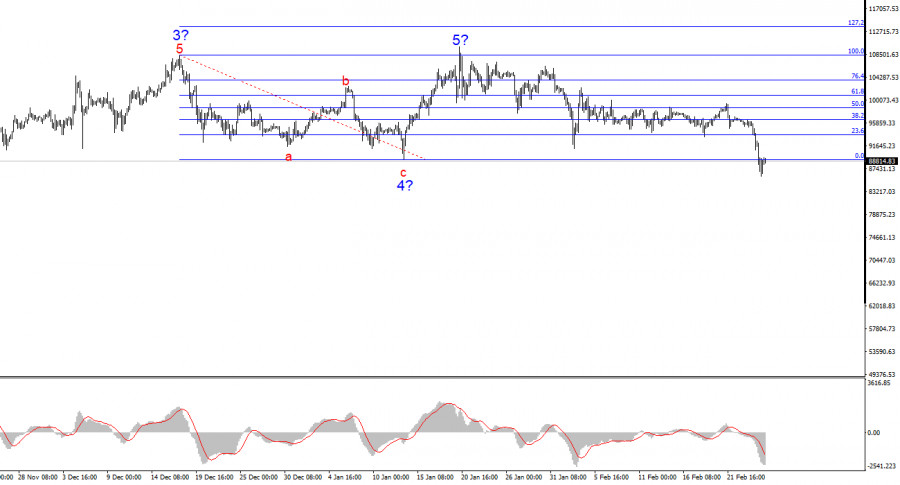
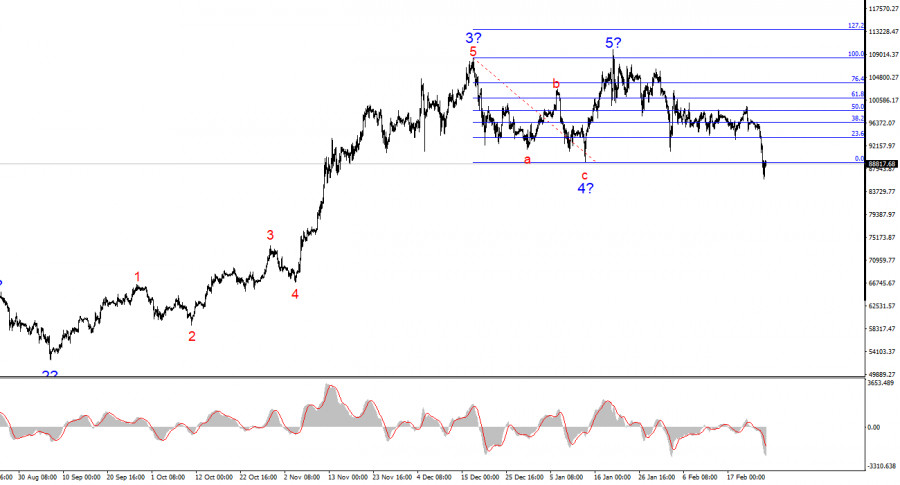
The wave analysis of the 4-hour BTC/USD chart is quite clear. After a long and complex a-b-c-d-e correction, which unfolded between March 14 and August 5, a new impulse wave began to form, developing into a five-wave structure.
Judging by the size of the first wave, the fifth wave appears to be shortened. Based on this, I did not expect—and still do not expect—Bitcoin to rise above $110,000–$115,000 in the coming months.
Besides, wave 4 consists of three elements, which confirms the accuracy of the current wave count. The news background has been supporting Bitcoin's growth due to a steady influx of institutional investments, including from government entities and pension funds.
However, Trump's policies could drive investors away from the crypto market. So, the flagship crypto may trade without a clear-cut trend indefinitely. The wave that began on January 20 does not resemble a true impulse wave, indicating that we are dealing with a complex corrective structure that could persist for months.
The crash has happened. Will it continue?
Over the past two days, BTC/USD has dropped by $6,500. However, this decline is not as severe as it might seem. Even after the sell-off on Monday and Tuesday, it is too early to confirm the start of a new bearish trend.
At this point, the price has only briefly broken below Wave 4's low. The internal structure of the wave that began on January 20 does not resemble a true impulse wave.
Thus, I lean toward the view that Bitcoin has entered a corrective phase, which could last for an extended period.
It's also important to note that a $20,000 drop from the last peak cannot be classified as a crash or a major correction. Yes, Bitcoin has fallen by $20,000, but before that, it had surged by nearly $100,000. Sharp price swings are an intrinsic feature of Bitcoin, so a $20,000 decline is merely one corrective wave.
Recently, the news backdrop has been relatively weak and was not the driving force behind the latest market downturn. Moreover, the decline was not sudden or drastic.
While I believe the downtrend could extend in the coming days, a full-scale collapse seems unlikely. The internal structure of the first wave in this new trend segment appears complex and unclear, so I am not identifying subwaves within it.
Based on my wave analysis of BTC/USD, I conclude that Bitcoin's bullish phase has ended. All signs indicate that a complex correction is underway.
That's why I have previously advised against buying Bitcoin, and now I strongly discourage it.
A drop below the low of wave 4 will confirm that BTC has entered a corrective downtrend. Given this, the best strategy is to look for short-selling opportunities on lower timeframes.
Bitcoin could drop to $83,000 (127.2% Fibonacci level) in the near future. On a higher wave scale, a five-wave bullish structure is visible, suggesting that a corrective downtrend is likely to form soon.
Key principles of my analysis:
You have already liked this post today
* Analisis pasaran yang disiarkan di sini adalah bertujuan untuk meningkatkan kesedaran anda, tetapi tidak untuk memberi arahan untuk membuat perdagangan.
Permintaan untuk bitcoin dan ether berlanjutan awal minggu ini. Bitcoin terus kekal di atas paras $109,000, manakala Ethereum cuba untuk mengukuh di atas $2,600. Berita semalam bahawa Strategy sekali lagi
Permintaan untuk Bitcoin dan Ethereum kembali meningkat pada awal minggu ini. Bitcoin telah melepasi tahap $109,000, manakala Ethereum sedang berusaha untuk mengukuhkan kedudukannya di atas paras $2,550. Semalam, Ketua Pegawai
Bitcoin terus membentuk struktur arah aliran menaik. Ada yang mungkin berpendapat sama ada terdapat alasan sebenar untuk arah aliran menaik baharu ketika ini, namun carta hanya menunjukkan perkara tersebut—secara jelas
Pergerakan harga mata wang kripto Doge pada carta 4 jam menunjukkan bahawa ia sedang bergerak di atas WMA (21) yang mempunyai cerun menaik, manakala penunjuk Pengayun Stochastic pula bersedia untuk
Jika kita melihat carta 4-jam bagi mata wang kripto Ripple, ia kelihatan bergerak di atas WMA (21) yang mempunyai cerun curam dan berjaya menembusi Tahap Nilai Tinggi (kuning) dan kemudian
Pada hari Khamis, harga Bitcoin telah mencapai paras sasaran 111,770. Pengayun Marlin kelihatan tertinggal di belakang pergerakan harga, memberikan gambaran kemungkinan berlaku perbezaan arah (divergence) — walaupun dalam bentuk yang
Pada 22 Mei, Bitcoin dengan yakin berjaya melepasi tahap $111,888, mencatat rekod tertinggi baharu pada $111,867. Tidak seperti kenaikan sebelum ini yang dicirikan oleh kegembiraan pelabur runcit, kali ini tingkah
 InstaFutures
Make money with a new promising instrument!
Kelab InstaTrade

Your IP address shows that you are currently located in the USA. If you are a resident of the United States, you are prohibited from using the services of InstaFintech Group including online trading, online transfers, deposit/withdrawal of funds, etc.
If you think you are seeing this message by mistake and your location is not the US, kindly proceed to the website. Otherwise, you must leave the website in order to comply with government restrictions.
Why does your IP address show your location as the USA?
Please confirm whether you are a US resident or not by clicking the relevant button below. If you choose the wrong option, being a US resident, you will not be able to open an account with InstaTrade anyway.
We are sorry for any inconvenience caused by this message.


