Lihat juga

 23.10.2024 05:55 PM
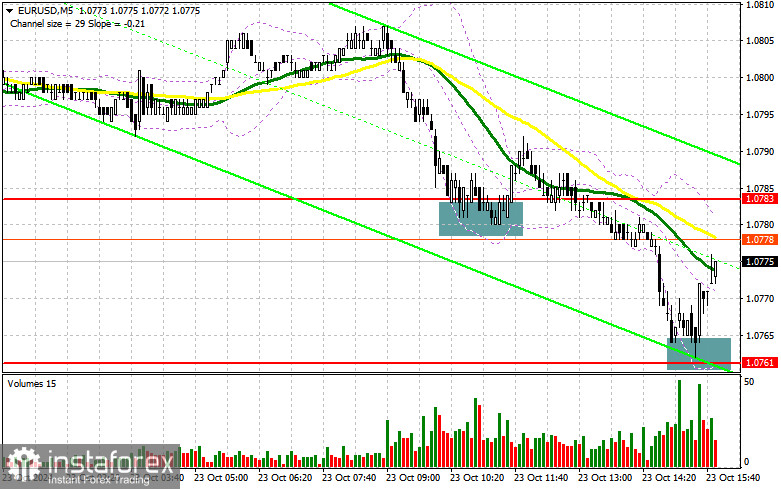
In my morning forecast, I focused on the 1.0783 level and planned to make market entry decisions based on it. Let's look at the 5-minute chart and see what happened. The decline and formation of a false breakout provided a great entry point for buying. However, as you can see on the chart, the pair did not manage to rise actively. After some time, the euro continued to fall, updating the low at 1.0761 with a similar entry point. This time, the pair rebounded by 20 points and is continuing to rise at the time of writing this article. The technical picture has not been revised for the second half of the day.
For opening long positions on EURUSD:
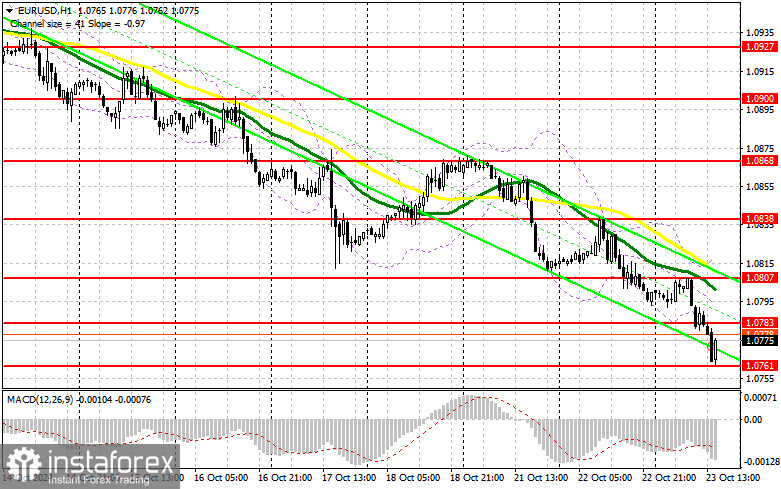
In the second half of the day, there are no significant statistics, and the publication of the Federal Reserve's "Beige Book" economic review is unlikely to significantly impact the market. We may hear something new in interviews with FOMC representatives Thomas Barkin and Michelle Bowman, but they seem to favor a more conservative policy, which could strengthen the dollar. If the pair reacts with a decline to the statements, action will only be considered around the support level of 1.0761, similar to what I analyzed earlier. A false breakout could serve as a good signal for building long positions, which could open the way back to the level of 1.0783. A breakout and retest of this range will confirm a favorable entry point for buying with the target of updating 1.0807. The farthest target will be the high of 1.0838, where I plan to take profits. If EUR/USD declines and there is no activity around 1.0761 in the second half of the day, the pressure on the euro will increase within the trend creating many problems for buyers. In such a case, I will only consider entering after a false breakout forms around the next support level of 1.0738. Long positions can be considered immediately on a rebound from 1.0711, targeting an upward correction of 30-35 points within the day.
For opening short positions on EURUSD:
Bears control the market. In the case of a rise, only a false breakout in the level of 1.0783 could provide an entry point for short positions with the prospect of further decline to the support at 1.0761. A breakout and consolidation below this range, as well as a bottom-up retest, will become another suitable option for selling, aiming for a move toward 1.0738, which will only strengthen the bearish market. Only at that level do I expect a stronger presence from buyers. The farthest target will be the level of 1.0711, where I will take profits. If EUR/USD moves up in the second half of the day and bears are absent at 1.0783, buyers will get a chance for a correction. In such a case, I will postpone sales until the test of the next resistance at 1.0807, where the moving averages support sellers. There, I will also sell, but only after an unsuccessful consolidation. I plan to open short positions immediately on a rebound from 1.0838 with a target of a downward correction of 30-35 points.
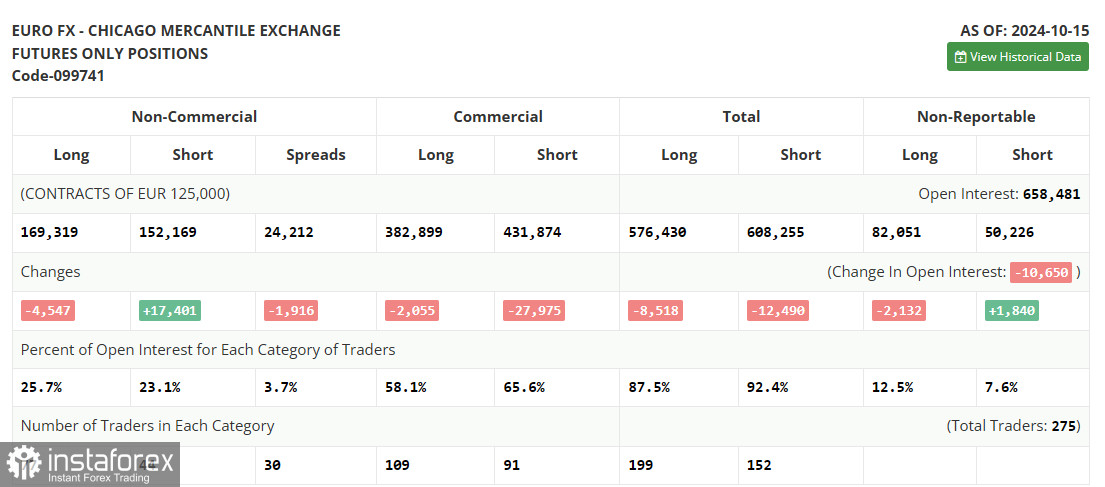
I recommend reviewing the Commitment of Traders (COT) report for October 15th, which showed a sharp increase in short positions and another reduction in long positions. Clearly, the recent decision by the European Central Bank to cut rates and the focus on a more aggressive easing policy by the end of the year have significantly changed the balance of power in the market. Risk asset buyers are no longer leading as actively, and the balance of power is practically even: 169,319 against 152,169. This week promises to be quite calm, as there are virtually no important statistics, so the focus will continue to be on the bearish market for the euro. The COT report indicates that long non-commercial positions decreased by 4,547 to 169,319, while short non-commercial positions increased by 17,401 to 152,169, reducing the gap between long and short positions by 1,402.
Indicator Signals:
Moving averages:
Trading below the 30 and 50-day moving averages indicates further decline in the pair.
Note: The period and prices of moving averages are considered by the author on the H1 hourly chart and differ from the general definition of classic daily moving averages on the D1 daily chart.
Bollinger Bands:
In case of a decline, the lower border of the indicator around 1.0761 will act as support.
Description of Indicators:
You have already liked this post today
* Analisis pasaran yang disiarkan di sini adalah bertujuan untuk meningkatkan kesedaran anda, tetapi tidak untuk memberi arahan untuk membuat perdagangan.


