Lihat juga


 14.04.2023 04:08 PM
Ethereum has been one of the best-performing cryptocurrencies in the market, with significant gains since the beginning of the year. The recent technical analysis of the Ethereum/USD chart shows a potential bullish trend in the near future.
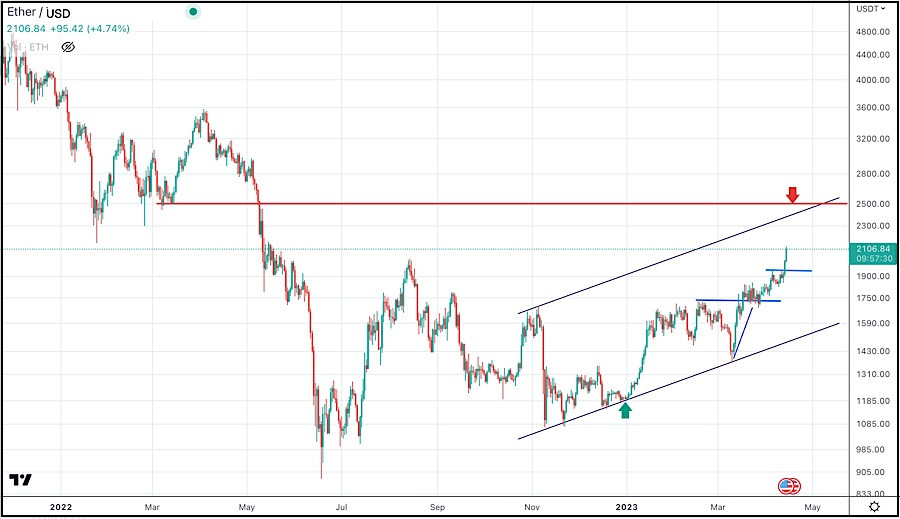
The updated technical analysis of the Ethereum/USD chart indicates that Ethereum has broken out of a key resistance level against USD, which could lead to further gains.
The cryptocurrency is trading within an ascending channel on the USD chart, signaling a potential bullish move.
Ethereum is trading above its 50-day moving average, indicating a bullish trend. However, the Relative Strength Index (RSI) is approaching overbought levels, which indicates a potential correction.
Hence, Ethereum may experience a pullback before continuing its upward trend against USD.
Traders should keep an eye on the price action around the 2500$ level, as it is a key resistance level. A break above this level could lead to further gains towards the 3000$ level. Conversely, a break below the 2000 $ support level could lead to a short-term bearish trend.
In summary, Ethereum against USD chart points to further continuation of the ongoing bullish trend, with a key resistance level at 2500.
Traders should be cautious and wait for confirmation of the bullish trend before entering any long positions.
You have already liked this post today
* Analisis pasaran yang disiarkan di sini adalah bertujuan untuk meningkatkan kesedaran anda, tetapi tidak untuk memberi arahan untuk membuat perdagangan.
Pada awal sesi dagangan Eropah, pasangan EUR/USD didagangkan sekitar paras 1.1224, berada di atas Purata Bergerak Eksponen (EMA) 200, namun masih di bawah tahap 6/8 Murray, dengan kecenderungan penurunan. Kemungkinan
Semalam, Bank of England telah mengurangkan kadar faedahnya sebanyak suku mata, dengan hanya tujuh anggota Jawatankuasa mengundi menyokong keputusan itu, bertentangan dengan jangkaan konsensus yang menganggarkan kesemua sembilan anggota akan
Pada pasangan EUR/GBP dijangka akan membalikkan arah aliran menurunnya dan mula meningkat. Penurunan berbentuk baji sejak 11 April jelas mempunyai struktur pembetulan, dan pergerakan menurun ini telah menunjukkan tanda-tanda awal
Pada carta satu jam, pasangan GBP/USD pada hari Rabu gagal meneruskan pergerakan menaik. Dalam dagangan semalaman, ia mengukuhkan kedudukan di bawah paras 1.3344–1.3357, kemudian pantas kembali ke zon tersebut
Dengan kemunculan Perbezaan antara pergerakan harga indeks Nasdaq 100 dan penunjuk Pengayun Stochastic serta pergerakan harga yang berada di atas SMA (50) yang sedang menaik, ini memberikan isyarat bahawa dalam
Pada carta 4 jam pasangan mata wang utama USD/JPY, walaupun kelihatan sedang mengukuh, perkara ini ditunjukkan oleh pergerakan harga USD/JPY yang berada di atas EMA (21), sekali gus berpotensi membawa
Seperti yang dijangkakan, Rizab Persekutuan mengekalkan dasar monetarinya tanpa perubahan selepas mesyuarat semalam. Jerome Powell hanya sedikit mengukuhkan jangkaan pasaran mengenai peningkatan inflasi. Pasaran masih menjangkakan pemotongan kadar faedah pertama
Your IP address shows that you are currently located in the USA. If you are a resident of the United States, you are prohibited from using the services of InstaFintech Group including online trading, online transfers, deposit/withdrawal of funds, etc.
If you think you are seeing this message by mistake and your location is not the US, kindly proceed to the website. Otherwise, you must leave the website in order to comply with government restrictions.
Why does your IP address show your location as the USA?
Please confirm whether you are a US resident or not by clicking the relevant button below. If you choose the wrong option, being a US resident, you will not be able to open an account with InstaTrade anyway.
We are sorry for any inconvenience caused by this message.

