

Өзекті паттерндер

Двойная вершина
сформирован 25.04 в 22:00:30 (UTC+0)
сила сигнала 4 из 5

На торговом графике EURNZD H1 сформировалась разворотная фигура «Двойная вершина». Характеристика: Верхняя граница 1.9079; Нижняя граница 1.9023; Ширина фигуры 56 пунктов. Сигнал: Пробой нижней границы 1.9023 приведет к дальнейшему нисходящему движению с перспективой хода к уровню 1.8983.
Сондай-ақ қараңыз
- Все
- Все
- Bearish Rectangle
- Bearish Symmetrical Triangle
- Bearish Symmetrical Triangle
- Bullish Rectangle
- Double Top
- Double Top
- Triple Bottom
- Triple Bottom
- Triple Top
- Triple Top
- Все
- Все
- Покупка
- Продажа
- Все
- 1
- 2
- 3
- 4
- 5
Double Bottom
was formed on 04.05 at 23:00:18 (UTC+0)
signal strength 2 of 5
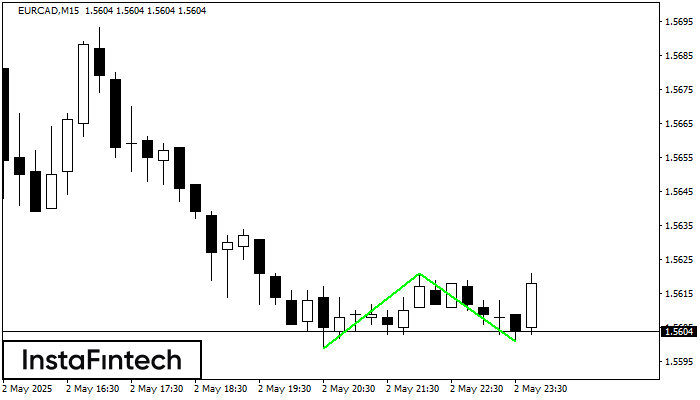
The Double Bottom pattern has been formed on EURCAD M15. This formation signals a reversal of the trend from downwards to upwards. The signal is that a buy trade should
The M5 and M15 time frames may have more false entry points.
Open chart in a new window
Bearish Symmetrical Triangle
was formed on 04.05 at 09:04:31 (UTC+0)
signal strength 2 of 5

According to the chart of M15, #Bitcoin formed the Bearish Symmetrical Triangle pattern. Trading recommendations: A breach of the lower border 95528.76 is likely to encourage a continuation
The M5 and M15 time frames may have more false entry points.
Open chart in a new window
Bearish Rectangle
was formed on 04.05 at 00:51:55 (UTC+0)
signal strength 3 of 5

According to the chart of M30, #Bitcoin formed the Bearish Rectangle. This type of a pattern indicates a trend continuation. It consists of two levels: resistance 96456.78 - 0.00
Open chart in a new window
