

Өзекті паттерндер

Двойное дно
сформирован 22.04 в 20:00:25 (UTC+0)
сила сигнала 1 из 5
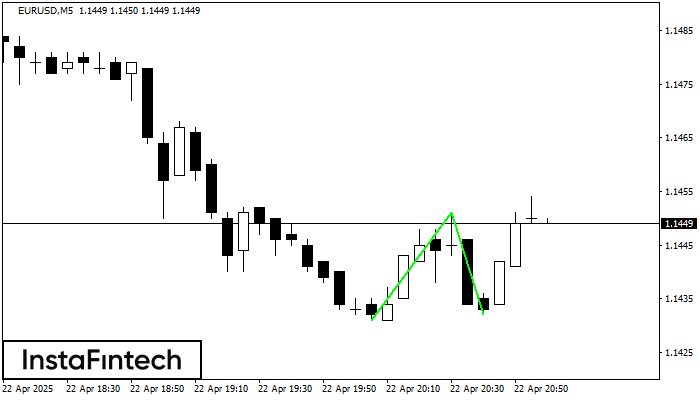
Сформирована фигура «Двойное дно» на графике EURUSD M5. Верхняя граница 1.1451; Нижняя граница 1.1432; Ширина фигуры 20 пунктов. В случае пробоя верхней границы 1.1451 можно будет прогнозировать изменение тенденции, где ширина фигуры и будет являться расстоянием предположительного Тейк Профита.
Таймфреймы М5 и М15 могут иметь больше ложных точек входа.
- Все
- Все
- Bearish Rectangle
- Bearish Symmetrical Triangle
- Bearish Symmetrical Triangle
- Bullish Rectangle
- Double Top
- Double Top
- Triple Bottom
- Triple Bottom
- Triple Top
- Triple Top
- Все
- Все
- Покупка
- Продажа
- Все
- 1
- 2
- 3
- 4
- 5
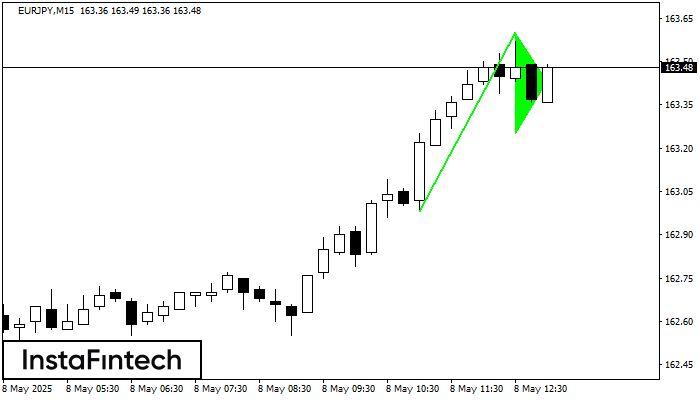
Bullish Flag
сформирован 08.05 в 12:10:56 (UTC+0)
сила сигнала 2 из 5

The Bullish Flag pattern has been formed on EURJPY at M15. The lower boundary of the pattern is located at 163.36/163.14, while the higher boundary lies at 163.60/163.38. The projection
The M5 and M15 time frames may have more false entry points.
Открыть график инструмента в новом окне
Bullish pennant
сформирован 08.05 в 12:10:51 (UTC+0)
сила сигнала 2 из 5
The Bullish pennant graphic pattern has formed on the EURJPY M15 instrument. This pattern type falls under the category of continuation patterns. In this case, if the quote can breaks
The M5 and M15 time frames may have more false entry points.
Открыть график инструмента в новом окне
Inverse Head and Shoulder
сформирован 08.05 в 11:55:15 (UTC+0)
сила сигнала 1 из 5
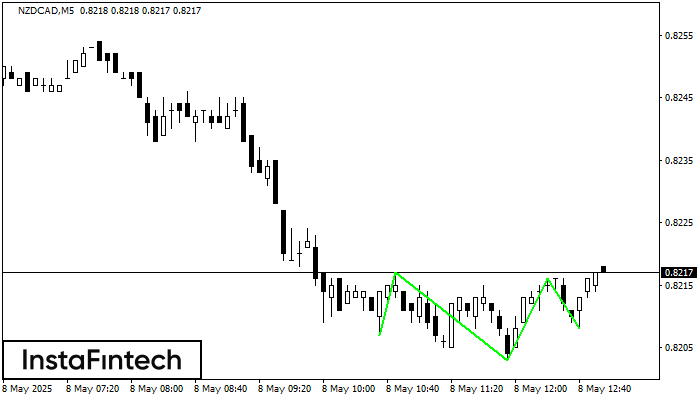
According to M5, NZDCAD is shaping the technical pattern – the Inverse Head and Shoulder. In case the Neckline 0.8217/0.8216 is broken out, the instrument is likely to move toward
The M5 and M15 time frames may have more false entry points.
Открыть график инструмента в новом окне


