

Өзекті паттерндер

Двойное дно
сформирован 22.04 в 15:30:30 (UTC+0)
сила сигнала 4 из 5
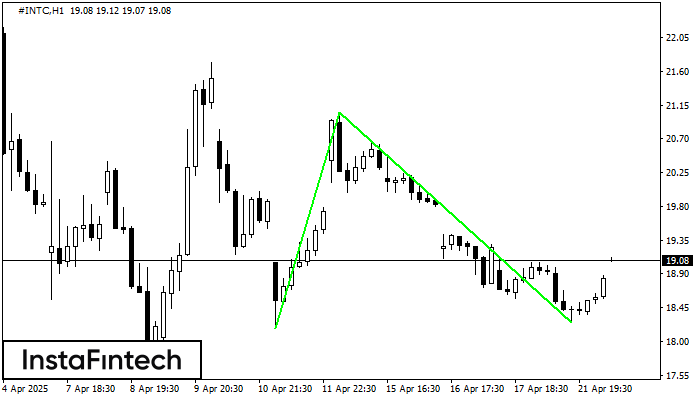
Сформирована фигура «Двойное дно» на графике #INTC H1. Верхняя граница 21.05; Нижняя граница 18.25; Ширина фигуры 287 пунктов. В случае пробоя верхней границы 21.05 можно будет прогнозировать изменение тенденции, где ширина фигуры и будет являться расстоянием предположительного Тейк Профита.
- Все
- Все
- Bearish Rectangle
- Bearish Symmetrical Triangle
- Bearish Symmetrical Triangle
- Bullish Rectangle
- Double Top
- Double Top
- Triple Bottom
- Triple Bottom
- Triple Top
- Triple Top
- Все
- Все
- Покупка
- Продажа
- Все
- 1
- 2
- 3
- 4
- 5
Bullish Symmetrical Triangle
was formed on 12.05 at 18:18:48 (UTC+0)
signal strength 1 of 5
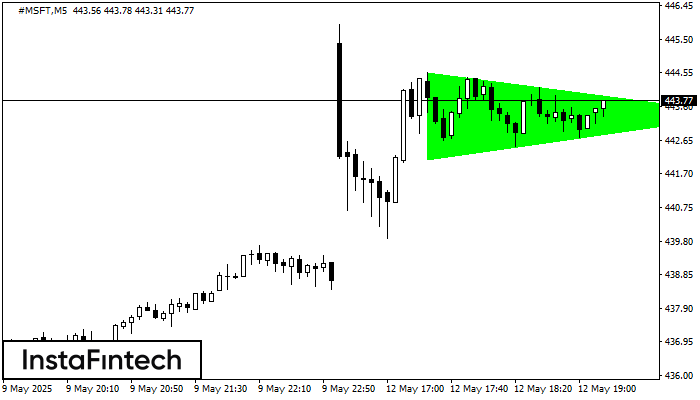
According to the chart of M5, #MSFT formed the Bullish Symmetrical Triangle pattern, which signals the trend will continue. Description. The upper border of the pattern touches the coordinates 444.56/443.38
The M5 and M15 time frames may have more false entry points.
Open chart in a new window
Double Bottom
was formed on 12.05 at 18:05:22 (UTC+0)
signal strength 1 of 5
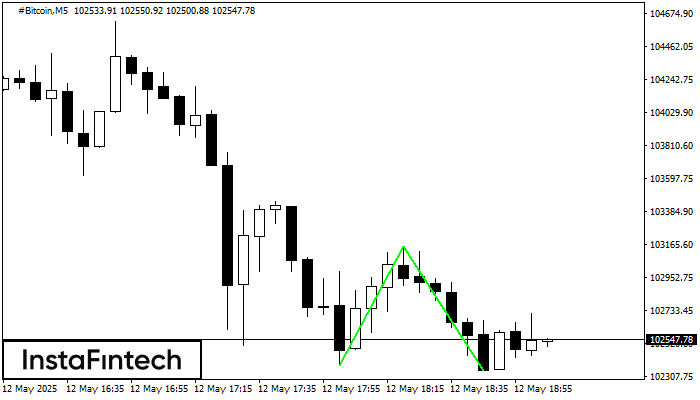
The Double Bottom pattern has been formed on #Bitcoin M5. This formation signals a reversal of the trend from downwards to upwards. The signal is that a buy trade should
The M5 and M15 time frames may have more false entry points.
Open chart in a new window
Triple Top
was formed on 12.05 at 17:55:24 (UTC+0)
signal strength 1 of 5
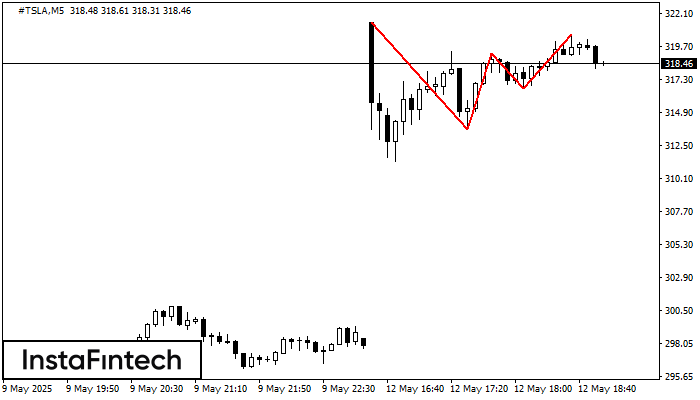
The Triple Top pattern has formed on the chart of the #TSLA M5 trading instrument. It is a reversal pattern featuring the following characteristics: resistance level 86, support level -304
The M5 and M15 time frames may have more false entry points.
Open chart in a new window


