

Өзекті паттерндер

Двойное дно
сформирован 22.04 в 14:06:13 (UTC+0)
сила сигнала 1 из 5

Сформирована фигура «Двойное дно» на графике NZDCHF M5. Верхняя граница 0.4874; Нижняя граница 0.4857; Ширина фигуры 17 пунктов. В случае пробоя верхней границы 0.4874 можно будет прогнозировать изменение тенденции, где ширина фигуры и будет являться расстоянием предположительного Тейк Профита.
Таймфреймы М5 и М15 могут иметь больше ложных точек входа.
Сондай-ақ қараңыз
- Все
- Все
- Bearish Rectangle
- Bearish Symmetrical Triangle
- Bearish Symmetrical Triangle
- Bullish Rectangle
- Double Top
- Double Top
- Triple Bottom
- Triple Bottom
- Triple Top
- Triple Top
- Все
- Все
- Покупка
- Продажа
- Все
- 1
- 2
- 3
- 4
- 5
Bearish Rectangle
сформирован 06.05 в 09:01:14 (UTC+0)
сила сигнала 4 из 5
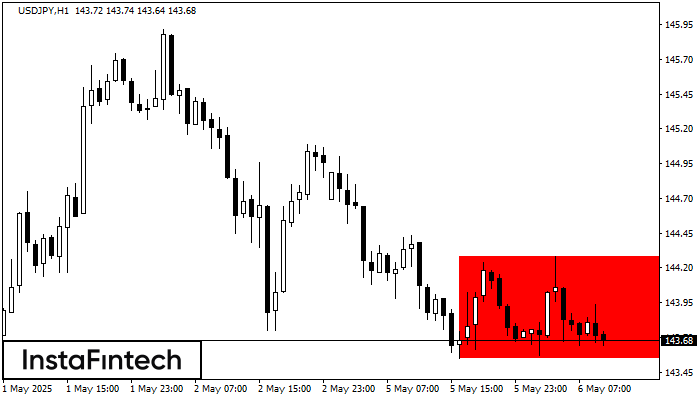
According to the chart of H1, USDJPY formed the Bearish Rectangle which is a pattern of a trend continuation. The pattern is contained within the following borders: lower border 143.55
Открыть график инструмента в новом окне
Bullish Symmetrical Triangle
сформирован 06.05 в 08:45:22 (UTC+0)
сила сигнала 1 из 5
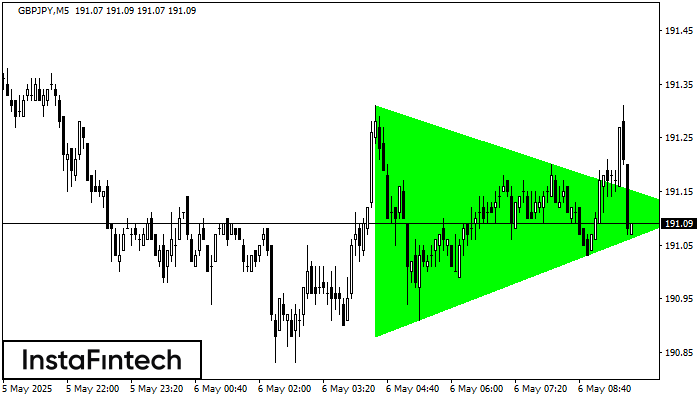
According to the chart of M5, GBPJPY formed the Bullish Symmetrical Triangle pattern. The lower border of the pattern touches the coordinates 190.88/191.11 whereas the upper border goes across 191.31/191.11
The M5 and M15 time frames may have more false entry points.
Открыть график инструмента в новом окне
Double Top
сформирован 06.05 в 08:00:10 (UTC+0)
сила сигнала 2 из 5
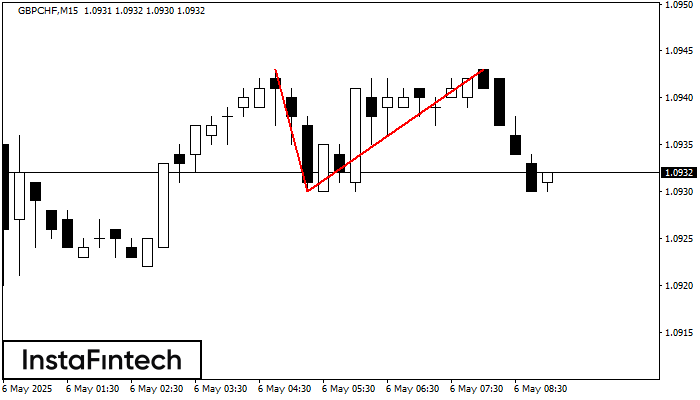
On the chart of GBPCHF M15 the Double Top reversal pattern has been formed. Characteristics: the upper boundary 1.0943; the lower boundary 1.0930; the width of the pattern 13 points
The M5 and M15 time frames may have more false entry points.
Открыть график инструмента в новом окне


