

Өзекті паттерндер

Двойное дно
сформирован 22.04 в 01:06:45 (UTC+0)
сила сигнала 1 из 5
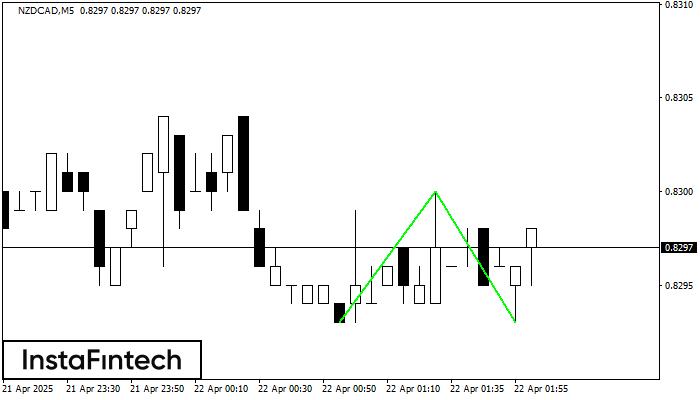
Сформирована фигура «Двойное дно» на графике NZDCAD M5. Данное формирование сигнализирует об изменении тенденции с нисходящего на восходящее движение. Сигнал: Торговую позицию на покупку следует открывать после пробоя верхней границы фигуры 0.8300, где перспектива будущего хода будет являться шириной текущей фигуры - 7 пунктов.
Таймфреймы М5 и М15 могут иметь больше ложных точек входа.
- Все
- Все
- Bearish Rectangle
- Bearish Symmetrical Triangle
- Bearish Symmetrical Triangle
- Bullish Rectangle
- Double Top
- Double Top
- Triple Bottom
- Triple Bottom
- Triple Top
- Triple Top
- Все
- Все
- Покупка
- Продажа
- Все
- 1
- 2
- 3
- 4
- 5
Inverse Head and Shoulder
was formed on 02.05 at 02:00:07 (UTC+0)
signal strength 3 of 5
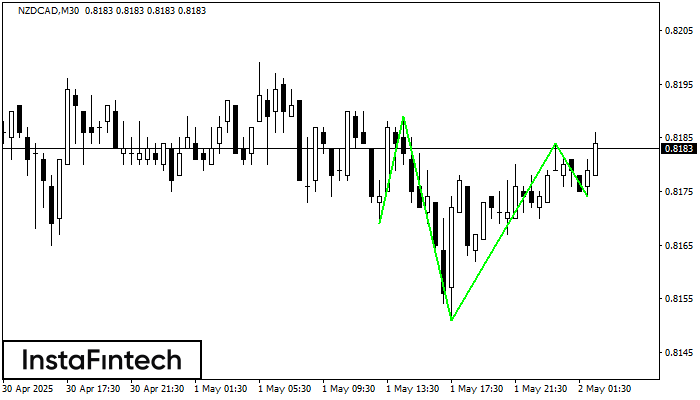
According to the chart of M30, NZDCAD formed the Inverse Head and Shoulder pattern. The Head’s top is set at 0.8184 while the median line of the Neck is found
Open chart in a new window
Inverse Head and Shoulder
was formed on 29.04 at 04:30:24 (UTC+0)
signal strength 3 of 5
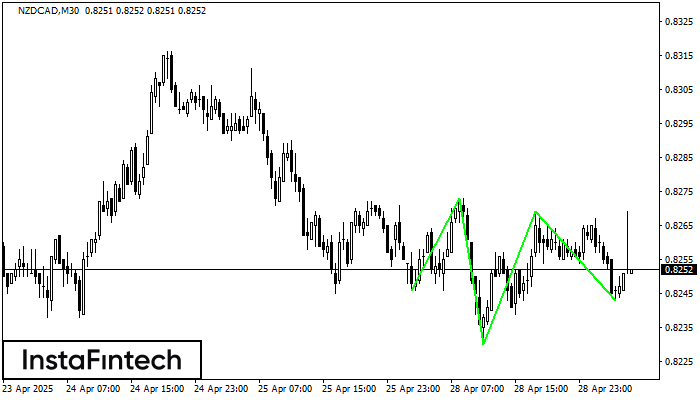
According to the chart of M30, NZDCAD formed the Inverse Head and Shoulder pattern. The Head’s top is set at 0.8269 while the median line of the Neck is found
Open chart in a new window
Inverse Head and Shoulder
was formed on 23.04 at 15:30:11 (UTC+0)
signal strength 3 of 5
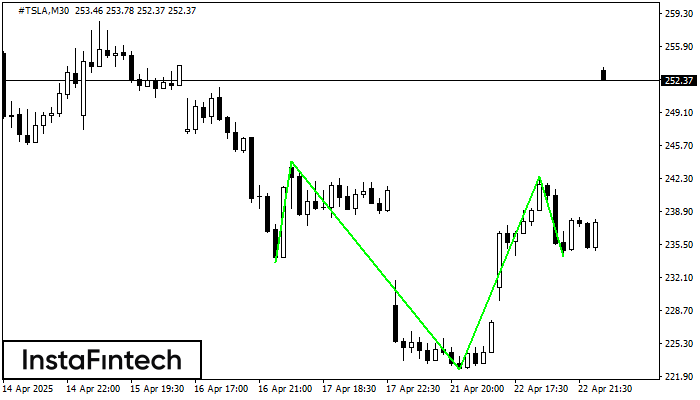
According to M30, #TSLA is shaping the technical pattern – the Inverse Head and Shoulder. In case the Neckline 244.08/242.52 is broken out, the instrument is likely to move toward
Open chart in a new window


