

Өзекті паттерндер

Бычий симметричный треугольник
сформирован 22.04 в 00:30:42 (UTC+0)
сила сигнала 1 из 5

По AUDCAD на M5 фигура «Бычий симметричный треугольник». Характеристика: Фигура продолжения тренда; Координаты границ – верхняя 0.8879, нижняя 0.8869. Проекция ширины фигуры 10 пунктов. Прогноз: В случае пробоя верхней границы 0.8879 цена, вероятнее всего, продолжит движение к 0.8889.
Таймфреймы М5 и М15 могут иметь больше ложных точек входа.
- Все
- Все
- Bearish Rectangle
- Bearish Symmetrical Triangle
- Bearish Symmetrical Triangle
- Bullish Rectangle
- Double Top
- Double Top
- Triple Bottom
- Triple Bottom
- Triple Top
- Triple Top
- Все
- Все
- Покупка
- Продажа
- Все
- 1
- 2
- 3
- 4
- 5
Double Top
was formed on 02.05 at 21:50:15 (UTC+0)
signal strength 1 of 5

The Double Top reversal pattern has been formed on USDJPY M5. Characteristics: the upper boundary 145.09; the lower boundary 144.90; the width of the pattern is 18 points. Sell trades
The M5 and M15 time frames may have more false entry points.
Open chart in a new window
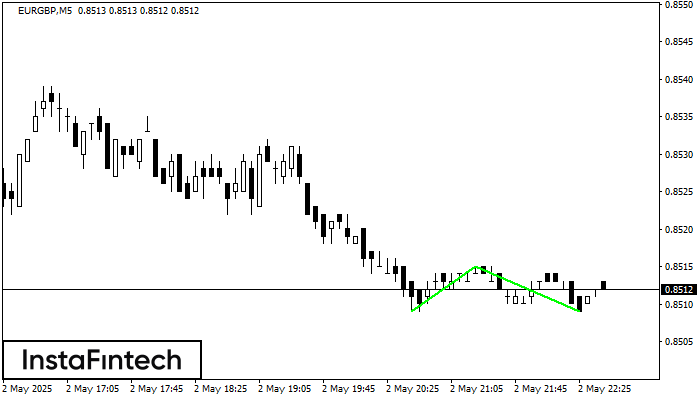
Triple Bottom
was formed on 02.05 at 21:45:21 (UTC+0)
signal strength 1 of 5

The Triple Bottom pattern has been formed on EURGBP M5. It has the following characteristics: resistance level 0.8515/0.8514; support level 0.8509/0.8509; the width is 6 points. In the event
The M5 and M15 time frames may have more false entry points.
Open chart in a new window
Double Bottom
was formed on 02.05 at 21:40:51 (UTC+0)
signal strength 1 of 5
The Double Bottom pattern has been formed on EURGBP M5; the upper boundary is 0.8515; the lower boundary is 0.8509. The width of the pattern is 6 points. In case
The M5 and M15 time frames may have more false entry points.
Open chart in a new window


