

Өзекті паттерндер

Двойная вершина
сформирован 16.04 в 10:45:17 (UTC+0)
сила сигнала 2 из 5
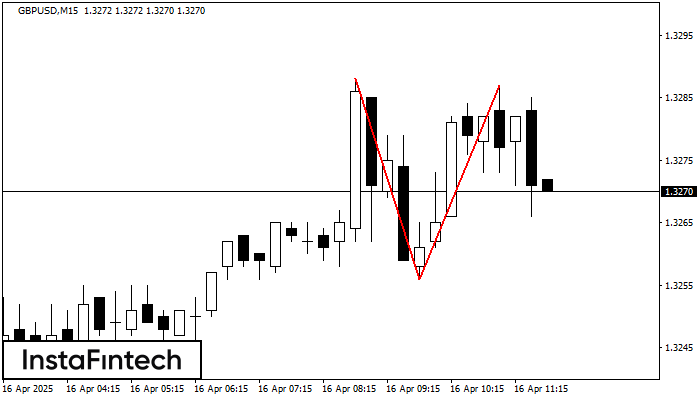
По GBPUSD на M15 сформировалась разворотная фигура «Двойная вершина». Характеристика: Верхняя граница 1.3288; Нижняя граница 1.3256; Ширина фигуры 31 пунктов. Позицию на продажу возможно открыть ниже нижней границы 1.3256, с перспективой хода к уровню 1.3233.
Таймфреймы М5 и М15 могут иметь больше ложных точек входа.
Сондай-ақ қараңыз
- Все
- Все
- Bearish Rectangle
- Bearish Symmetrical Triangle
- Bearish Symmetrical Triangle
- Bullish Rectangle
- Double Top
- Double Top
- Triple Bottom
- Triple Bottom
- Triple Top
- Triple Top
- Все
- Все
- Покупка
- Продажа
- Все
- 1
- 2
- 3
- 4
- 5
Double Bottom
was formed on 11.05 at 23:55:31 (UTC+0)
signal strength 1 of 5
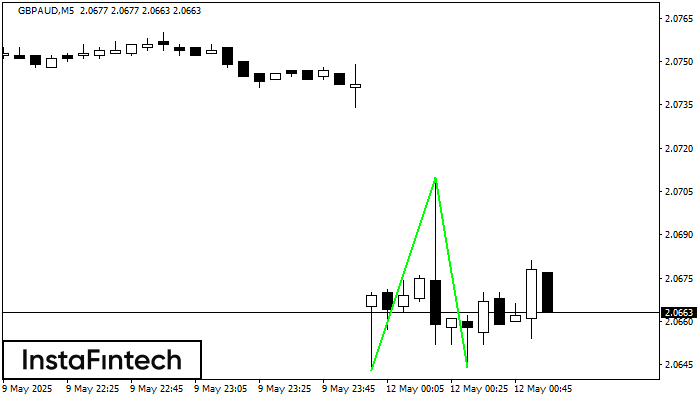
The Double Bottom pattern has been formed on GBPAUD M5. Characteristics: the support level 2.0643; the resistance level 2.0710; the width of the pattern 67 points. If the resistance level
The M5 and M15 time frames may have more false entry points.
Open chart in a new window
Bearish Flag
was formed on 11.05 at 23:51:00 (UTC+0)
signal strength 2 of 5
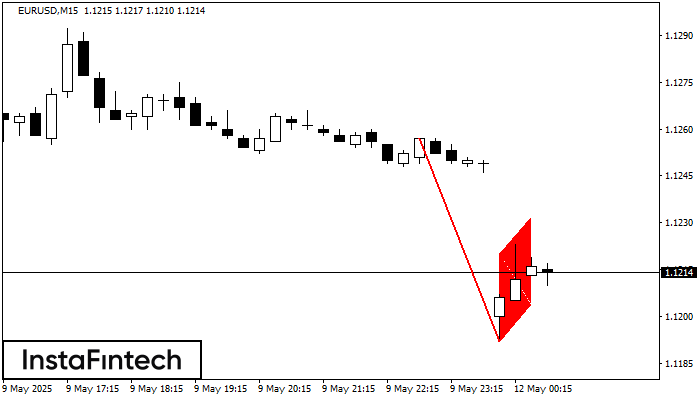
The Bearish Flag pattern has been formed on the chart EURUSD M15 which signals that the downward trend will continue. If the price breaks below the low at 1.1192, then
The M5 and M15 time frames may have more false entry points.
Open chart in a new window
Bullish Rectangle
was formed on 11.05 at 23:32:05 (UTC+0)
signal strength 1 of 5

According to the chart of M5, NZDCAD formed the Bullish Rectangle which is a pattern of a trend continuation. The pattern is contained within the following borders: the lower border
The M5 and M15 time frames may have more false entry points.
Open chart in a new window


