

Өзекті паттерндер

Медвежий флаг
сформирован 16.04 в 00:23:57 (UTC+0)
сила сигнала 1 из 5

На графике AUDCAD M5 сформировалась графическая фигура «Медвежий флаг». Ссылаясь на теорию графического анализа, можно сказать, что в ближайшее время тренд продолжит нисходящее движение, как только цена зафиксируется ниже минимума фигуры 0.8835, где трейдеру и следовало бы входить в позицию.
Таймфреймы М5 и М15 могут иметь больше ложных точек входа.
- Все
- Все
- Bearish Rectangle
- Bearish Symmetrical Triangle
- Bearish Symmetrical Triangle
- Bullish Rectangle
- Double Top
- Double Top
- Triple Bottom
- Triple Bottom
- Triple Top
- Triple Top
- Все
- Все
- Покупка
- Продажа
- Все
- 1
- 2
- 3
- 4
- 5
Head and Shoulders
сформирован 14.05 в 15:30:27 (UTC+0)
сила сигнала 3 из 5
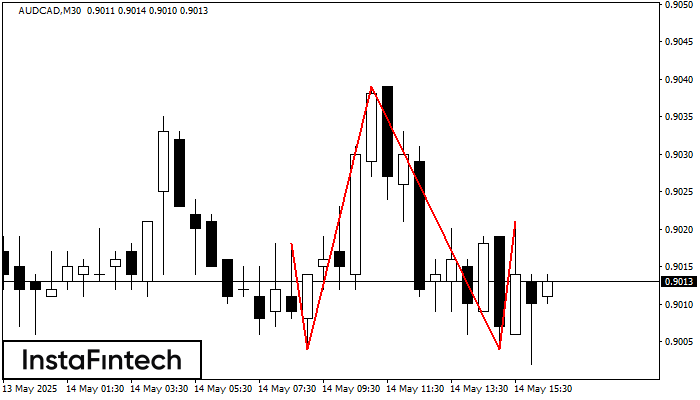
The AUDCAD M30 formed the Head and Shoulders pattern with the following features: The Head’s top is at 0.9039, the Neckline and the upward angle are at 0.9004/0.9004. The formation
Открыть график инструмента в новом окне
Bearish Flag
сформирован 14.05 в 15:29:48 (UTC+0)
сила сигнала 1 из 5
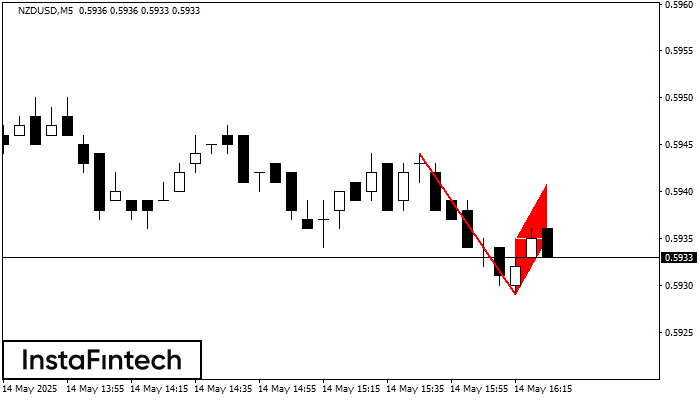
The Bearish Flag pattern has been formed on the chart NZDUSD M5. Therefore, the downwards trend is likely to continue in the nearest term. As soon as the price breaks
The M5 and M15 time frames may have more false entry points.
Открыть график инструмента в новом окне
Bearish pennant
сформирован 14.05 в 15:29:42 (UTC+0)
сила сигнала 1 из 5
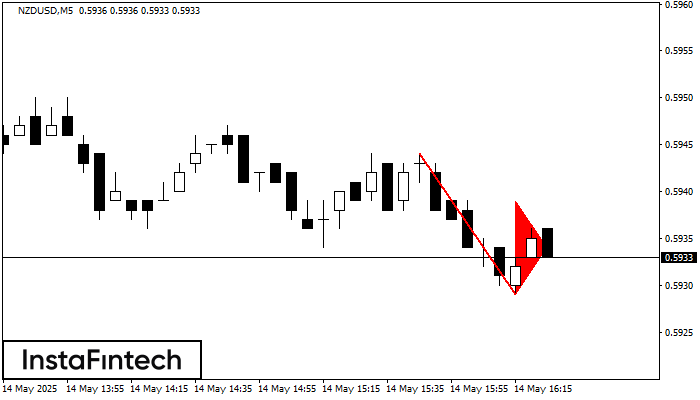
The Bearish pennant pattern has formed on the NZDUSD M5 chart. The pattern signals continuation of the downtrend in case the pennant’s low of 0.5929 is broken through. Recommendations: Place
The M5 and M15 time frames may have more false entry points.
Открыть график инструмента в новом окне


