

Өзекті паттерндер

Двойная вершина
сформирован 16.04 в 00:00:27 (UTC+0)
сила сигнала 3 из 5
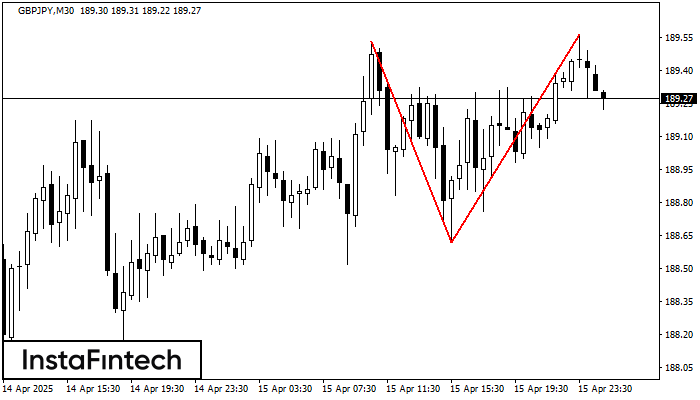
По GBPJPY на M30 сформировалась разворотная фигура «Двойная вершина». Характеристика: Верхняя граница 189.53; Нижняя граница 188.62; Ширина фигуры 94 пунктов. Позицию на продажу возможно открыть ниже нижней границы 188.62, с перспективой хода к уровню 188.32.
- Все
- Все
- Bearish Rectangle
- Bearish Symmetrical Triangle
- Bearish Symmetrical Triangle
- Bullish Rectangle
- Double Top
- Double Top
- Triple Bottom
- Triple Bottom
- Triple Top
- Triple Top
- Все
- Все
- Покупка
- Продажа
- Все
- 1
- 2
- 3
- 4
- 5
Double Bottom
was formed on 13.05 at 23:02:28 (UTC+0)
signal strength 1 of 5
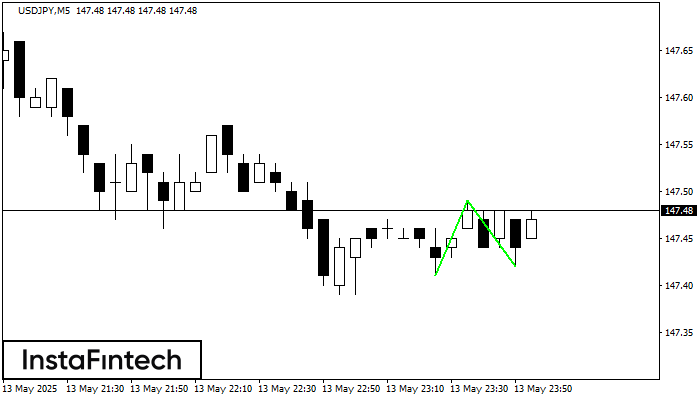
The Double Bottom pattern has been formed on USDJPY M5. Characteristics: the support level 147.41; the resistance level 147.49; the width of the pattern 8 points. If the resistance level
The M5 and M15 time frames may have more false entry points.
Open chart in a new window
Double Bottom
was formed on 13.05 at 22:45:59 (UTC+0)
signal strength 1 of 5
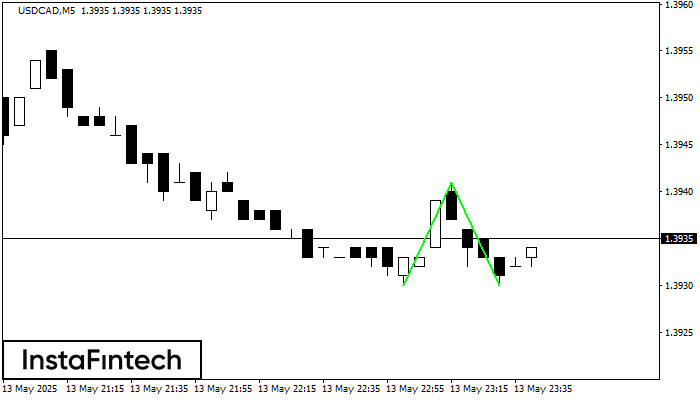
The Double Bottom pattern has been formed on USDCAD M5; the upper boundary is 1.3941; the lower boundary is 1.3930. The width of the pattern is 11 points. In case
The M5 and M15 time frames may have more false entry points.
Open chart in a new window
Bearish Symmetrical Triangle
was formed on 13.05 at 21:54:58 (UTC+0)
signal strength 2 of 5
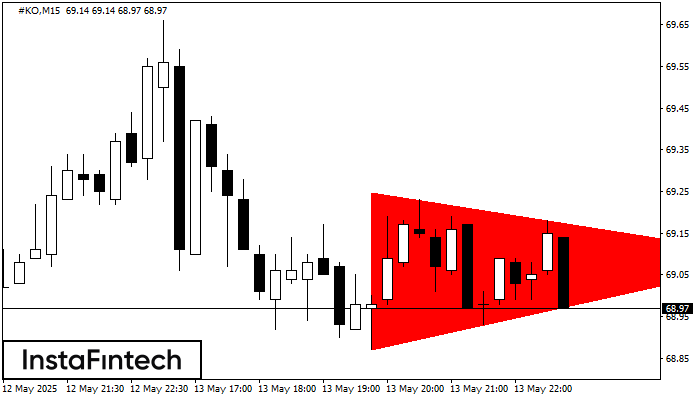
According to the chart of M15, #KO formed the Bearish Symmetrical Triangle pattern. Description: The lower border is 68.87/69.09 and upper border is 69.25/69.09. The pattern width is measured
The M5 and M15 time frames may have more false entry points.
Open chart in a new window


