

Өзекті паттерндер

Двойное дно
сформирован 15.04 в 21:15:37 (UTC+0)
сила сигнала 2 из 5
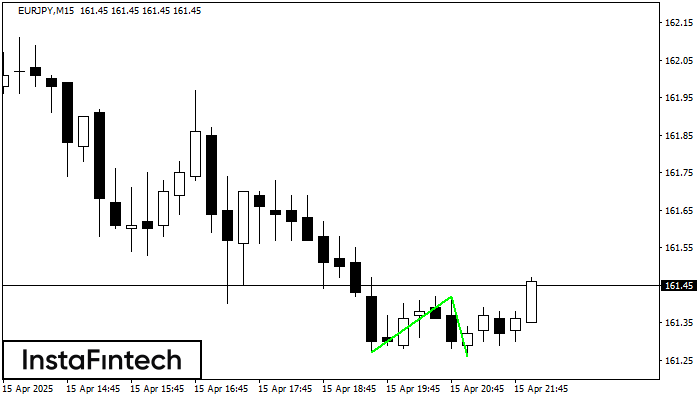
Сформирована фигура «Двойное дно» на графике EURJPY M15. Верхняя граница 161.42; Нижняя граница 161.26; Ширина фигуры 15 пунктов. В случае пробоя верхней границы 161.42 можно будет прогнозировать изменение тенденции, где ширина фигуры и будет являться расстоянием предположительного Тейк Профита.
Таймфреймы М5 и М15 могут иметь больше ложных точек входа.
Сондай-ақ қараңыз
- Все
- Все
- Bearish Rectangle
- Bearish Symmetrical Triangle
- Bearish Symmetrical Triangle
- Bullish Rectangle
- Double Top
- Double Top
- Triple Bottom
- Triple Bottom
- Triple Top
- Triple Top
- Все
- Все
- Покупка
- Продажа
- Все
- 1
- 2
- 3
- 4
- 5
Inverse Head and Shoulder
сформирован 08.05 в 11:55:15 (UTC+0)
сила сигнала 1 из 5
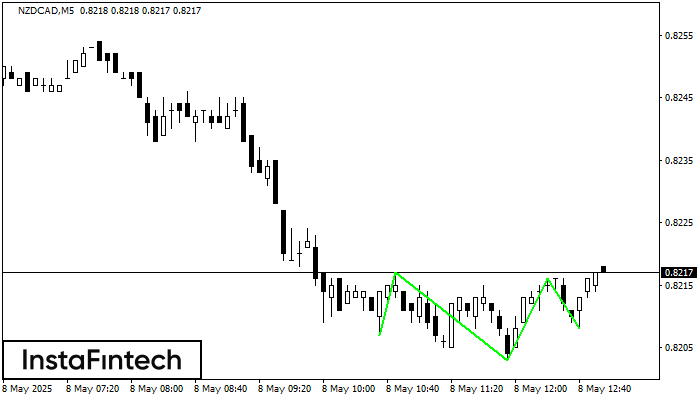
According to M5, NZDCAD is shaping the technical pattern – the Inverse Head and Shoulder. In case the Neckline 0.8217/0.8216 is broken out, the instrument is likely to move toward
The M5 and M15 time frames may have more false entry points.
Открыть график инструмента в новом окне
Triple Bottom
сформирован 08.05 в 11:11:41 (UTC+0)
сила сигнала 1 из 5
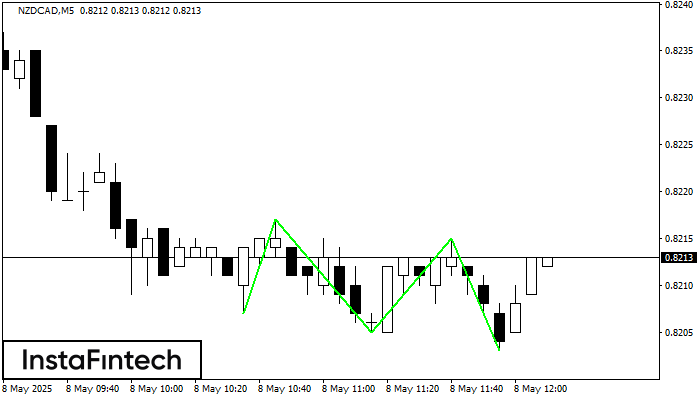
The Triple Bottom pattern has formed on the chart of NZDCAD M5. Features of the pattern: The lower line of the pattern has coordinates 0.8217 with the upper limit 0.8217/0.8215
The M5 and M15 time frames may have more false entry points.
Открыть график инструмента в новом окне
Bearish Symmetrical Triangle
сформирован 08.05 в 11:01:57 (UTC+0)
сила сигнала 2 из 5
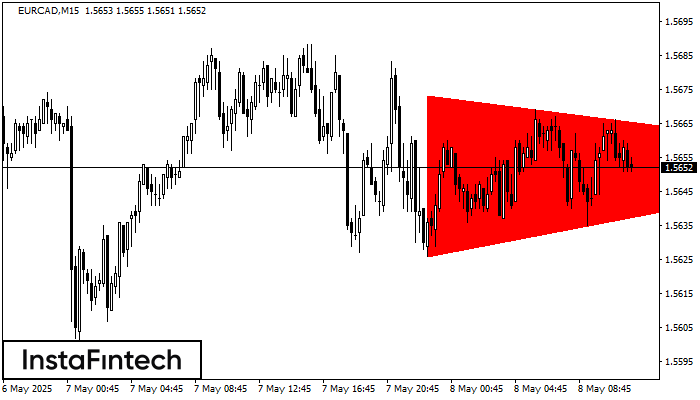
According to the chart of M15, EURCAD formed the Bearish Symmetrical Triangle pattern. This pattern signals a further downward trend in case the lower border 1.5626 is breached. Here
The M5 and M15 time frames may have more false entry points.
Открыть график инструмента в новом окне


