

Өзекті паттерндер

Двойная вершина
сформирован 15.04 в 08:30:13 (UTC+0)
сила сигнала 3 из 5
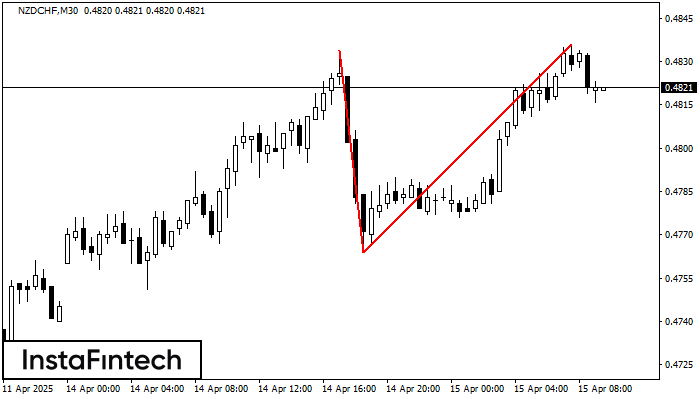
На торговом графике NZDCHF M30 сформировалась разворотная фигура «Двойная вершина». Характеристика: Верхняя граница 0.4836; Нижняя граница 0.4764; Ширина фигуры 72 пунктов. Сигнал: Пробой нижней границы 0.4764 приведет к дальнейшему нисходящему движению с перспективой хода к уровню 0.4734.
Сондай-ақ қараңыз
- Все
- Все
- Bearish Rectangle
- Bearish Symmetrical Triangle
- Bearish Symmetrical Triangle
- Bullish Rectangle
- Double Top
- Double Top
- Triple Bottom
- Triple Bottom
- Triple Top
- Triple Top
- Все
- Все
- Покупка
- Продажа
- Все
- 1
- 2
- 3
- 4
- 5
Double Bottom
was formed on 05.05 at 02:45:03 (UTC+0)
signal strength 1 of 5
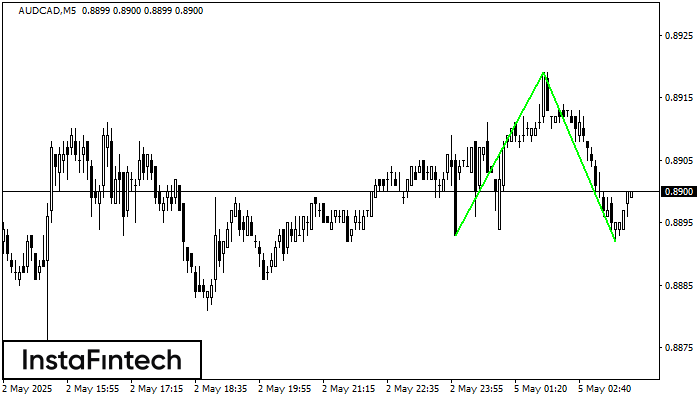
The Double Bottom pattern has been formed on AUDCAD M5. This formation signals a reversal of the trend from downwards to upwards. The signal is that a buy trade should
The M5 and M15 time frames may have more false entry points.
Open chart in a new window
Double Bottom
was formed on 05.05 at 00:30:20 (UTC+0)
signal strength 3 of 5

The Double Bottom pattern has been formed on EURCAD M30. Characteristics: the support level 1.5599; the resistance level 1.5621; the width of the pattern 22 points. If the resistance level
Open chart in a new window
Bearish Rectangle
was formed on 04.05 at 23:37:44 (UTC+0)
signal strength 1 of 5

According to the chart of M5, EURUSD formed the Bearish Rectangle. This type of a pattern indicates a trend continuation. It consists of two levels: resistance 1.1308 - 0.0000
The M5 and M15 time frames may have more false entry points.
Open chart in a new window


