

Өзекті паттерндер

Тройная вершина
сформирован 14.04 в 18:00:11 (UTC+0)
сила сигнала 4 из 5
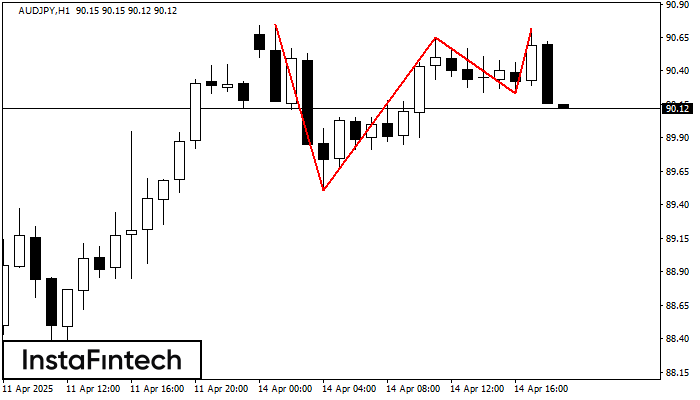
На графике AUDJPY H1 образовалась фигура «Тройная вершина». Данная фигура относится к типу разворотных и имеет характеристику: Верхняя граница 90.75/90.72; Нижняя граница 89.51/90.23; Ширина фигуры 42 пунктов. Прогноз: В случае пробоя нижней границы 89.51 вероятно дальнейшее нисходящее движение к уровню 90.25.
Сондай-ақ қараңыз
- Все
- Все
- Bearish Rectangle
- Bearish Symmetrical Triangle
- Bearish Symmetrical Triangle
- Bullish Rectangle
- Double Top
- Double Top
- Triple Bottom
- Triple Bottom
- Triple Top
- Triple Top
- Все
- Все
- Покупка
- Продажа
- Все
- 1
- 2
- 3
- 4
- 5
Double Bottom
сформирован 07.05 в 18:45:20 (UTC+0)
сила сигнала 2 из 5
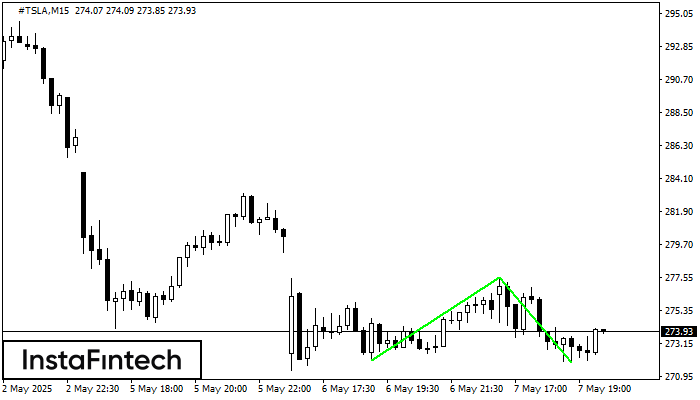
The Double Bottom pattern has been formed on #TSLA M15. Characteristics: the support level 272.03; the resistance level 277.52; the width of the pattern 549 points. If the resistance level
The M5 and M15 time frames may have more false entry points.
Открыть график инструмента в новом окне
Double Bottom
сформирован 07.05 в 18:45:11 (UTC+0)
сила сигнала 2 из 5
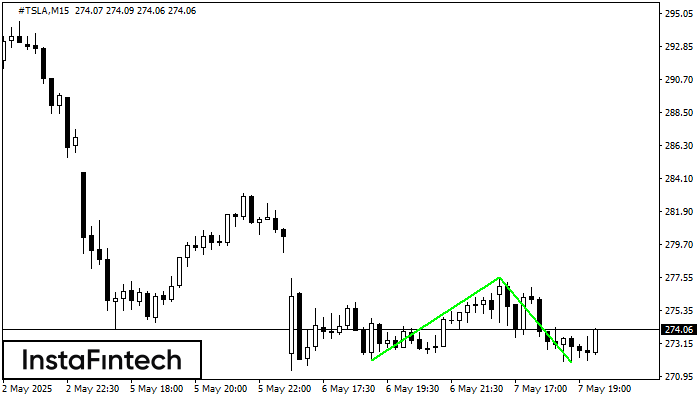
The Double Bottom pattern has been formed on #TSLA M15; the upper boundary is 277.52; the lower boundary is 271.92. The width of the pattern is 549 points. In case
The M5 and M15 time frames may have more false entry points.
Открыть график инструмента в новом окне
Bullish pennant
сформирован 07.05 в 18:40:15 (UTC+0)
сила сигнала 1 из 5
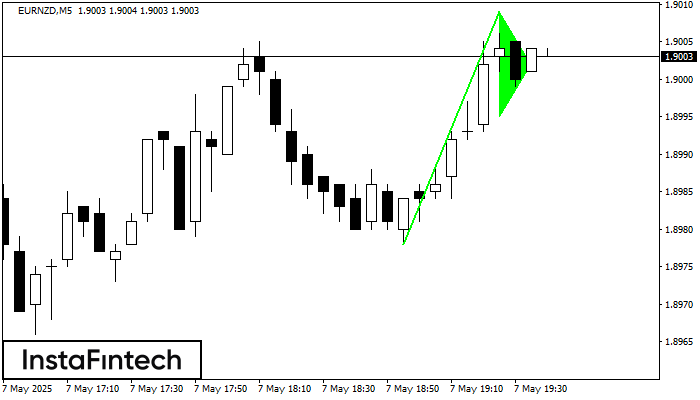
The Bullish pennant pattern is formed on the EURNZD M5 chart. It is a type of the continuation pattern. Supposedly, in case the price is fixed above the pennant’s high
The M5 and M15 time frames may have more false entry points.
Открыть график инструмента в новом окне


