

Өзекті паттерндер

Тройное дно
сформирован 14.04 в 06:15:49 (UTC+0)
сила сигнала 1 из 5
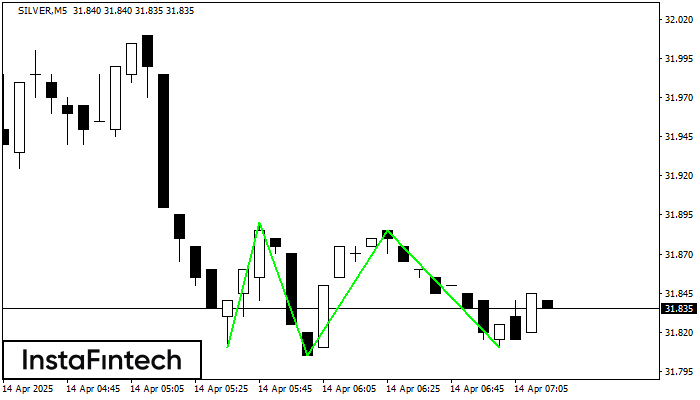
Сформирована фигура «Тройное дно» по торговому инструменту SILVER на M5. Фигура сигнализирует об изменении тенденции с нисходящей на восходящую в случае пробоя верхней границы 31.89.
Таймфреймы М5 и М15 могут иметь больше ложных точек входа.
- Все
- Все
- Bearish Rectangle
- Bearish Symmetrical Triangle
- Bearish Symmetrical Triangle
- Bullish Rectangle
- Double Top
- Double Top
- Triple Bottom
- Triple Bottom
- Triple Top
- Triple Top
- Все
- Все
- Покупка
- Продажа
- Все
- 1
- 2
- 3
- 4
- 5
Double Top
was formed on 14.05 at 06:00:37 (UTC+0)
signal strength 4 of 5
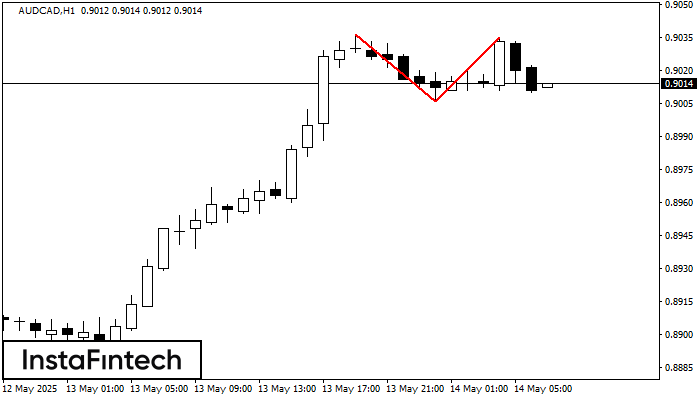
On the chart of AUDCAD H1 the Double Top reversal pattern has been formed. Characteristics: the upper boundary 0.9035; the lower boundary 0.9006; the width of the pattern 29 points
Open chart in a new window
Double Top
was formed on 14.05 at 06:00:37 (UTC+0)
signal strength 3 of 5
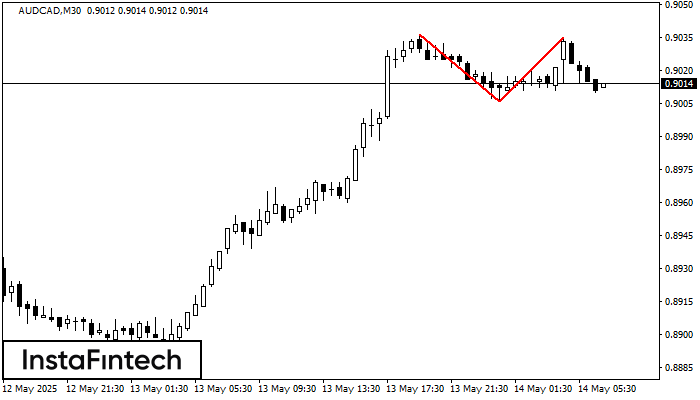
The Double Top reversal pattern has been formed on AUDCAD M30. Characteristics: the upper boundary 0.9036; the lower boundary 0.9006; the width of the pattern is 29 points. Sell trades
Open chart in a new window
Bullish Rectangle
was formed on 14.05 at 05:59:27 (UTC+0)
signal strength 2 of 5
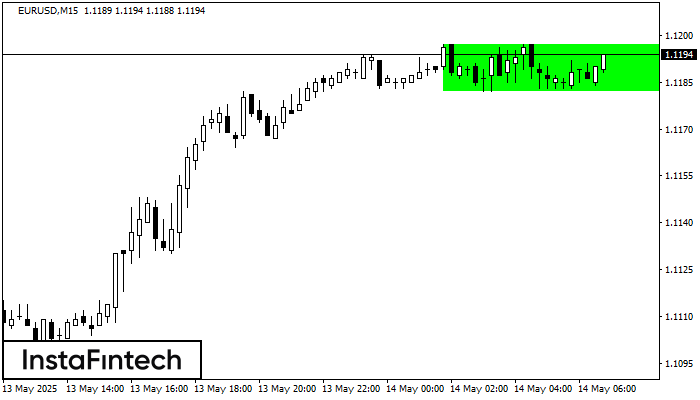
According to the chart of M15, EURUSD formed the Bullish Rectangle. This type of a pattern indicates a trend continuation. It consists of two levels: resistance 1.1197 and support 1.1182
The M5 and M15 time frames may have more false entry points.
Open chart in a new window


