

Өзекті паттерндер

Двойное дно
сформирован 14.04 в 01:30:09 (UTC+0)
сила сигнала 2 из 5
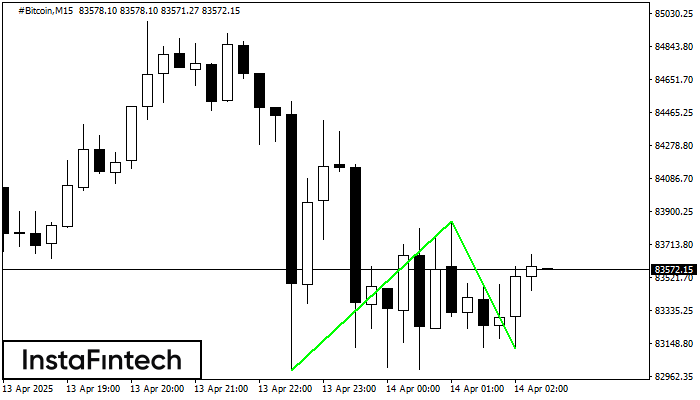
Сформирована фигура «Двойное дно» на графике #Bitcoin M15. Верхняя граница 83846.39; Нижняя граница 83118.34; Ширина фигуры 85123 пунктов. В случае пробоя верхней границы 83846.39 можно будет прогнозировать изменение тенденции, где ширина фигуры и будет являться расстоянием предположительного Тейк Профита.
Таймфреймы М5 и М15 могут иметь больше ложных точек входа.
- Все
- Все
- Bearish Rectangle
- Bearish Symmetrical Triangle
- Bearish Symmetrical Triangle
- Bullish Rectangle
- Double Top
- Double Top
- Triple Bottom
- Triple Bottom
- Triple Top
- Triple Top
- Все
- Все
- Покупка
- Продажа
- Все
- 1
- 2
- 3
- 4
- 5
Double Bottom
was formed on 09.05 at 16:20:05 (UTC+0)
signal strength 1 of 5
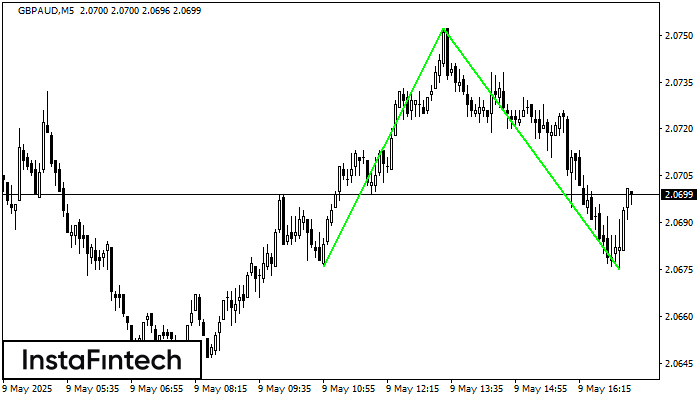
The Double Bottom pattern has been formed on GBPAUD M5. Characteristics: the support level 2.0676; the resistance level 2.0752; the width of the pattern 76 points. If the resistance level
The M5 and M15 time frames may have more false entry points.
Open chart in a new window
Inverse Head and Shoulder
was formed on 09.05 at 16:00:01 (UTC+0)
signal strength 3 of 5
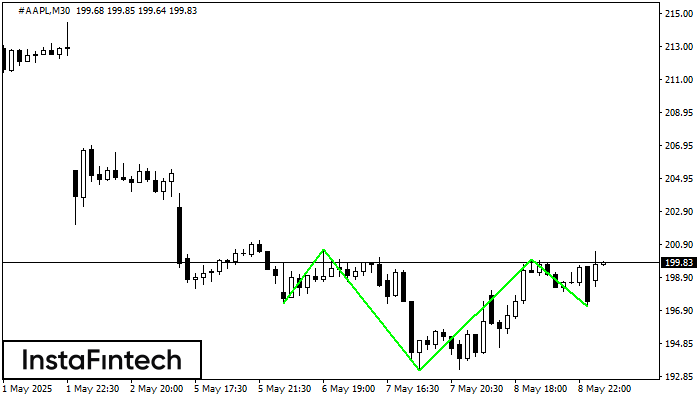
According to M30, #AAPL is shaping the technical pattern – the Inverse Head and Shoulder. In case the Neckline 200.60/200.00 is broken out, the instrument is likely to move toward
Open chart in a new window
Bullish Rectangle
was formed on 09.05 at 15:45:48 (UTC+0)
signal strength 4 of 5
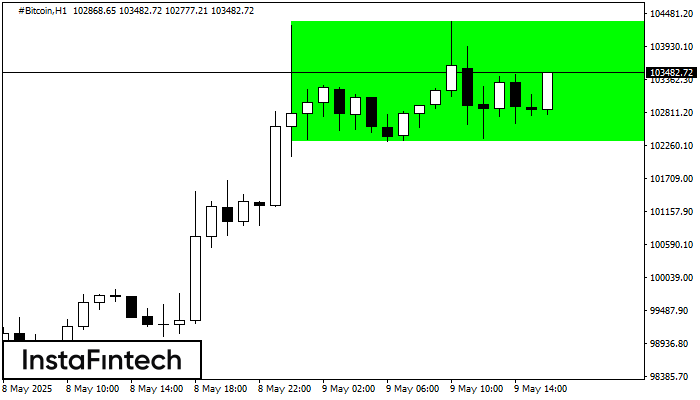
According to the chart of H1, #Bitcoin formed the Bullish Rectangle which is a pattern of a trend continuation. The pattern is contained within the following borders: the lower border
Open chart in a new window


