

Өзекті паттерндер

Тройная вершина
сформирован 09.04 в 23:20:13 (UTC+0)
сила сигнала 1 из 5
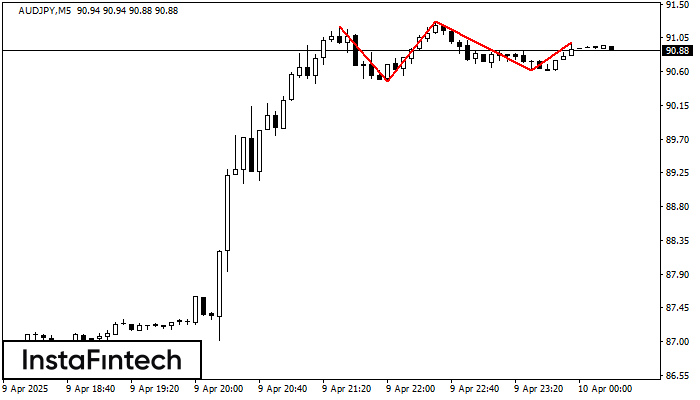
На графике AUDJPY M5 образовалась фигура «Тройная вершина». Данная фигура относится к типу разворотных и имеет характеристику: Верхняя граница 91.20/90.98; Нижняя граница 90.47/90.61; Ширина фигуры 65 пунктов. Прогноз: В случае пробоя нижней границы 90.47 вероятно дальнейшее нисходящее движение к уровню 91.11.
Таймфреймы М5 и М15 могут иметь больше ложных точек входа.
- Все
- Все
- Bearish Rectangle
- Bearish Symmetrical Triangle
- Bearish Symmetrical Triangle
- Bullish Rectangle
- Double Top
- Double Top
- Triple Bottom
- Triple Bottom
- Triple Top
- Triple Top
- Все
- Все
- Покупка
- Продажа
- Все
- 1
- 2
- 3
- 4
- 5
Bullish Rectangle
was formed on 05.05 at 10:31:43 (UTC+0)
signal strength 1 of 5
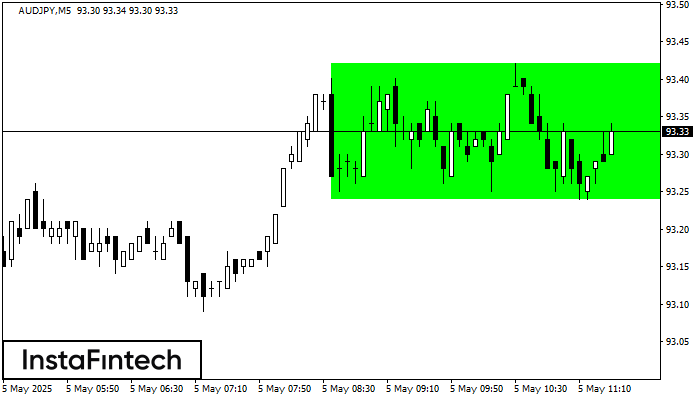
According to the chart of M5, AUDJPY formed the Bullish Rectangle. The pattern indicates a trend continuation. The upper border is 93.42, the lower border is 93.24. The signal means
The M5 and M15 time frames may have more false entry points.
Open chart in a new window
Triple Bottom
was formed on 05.05 at 10:00:09 (UTC+0)
signal strength 3 of 5
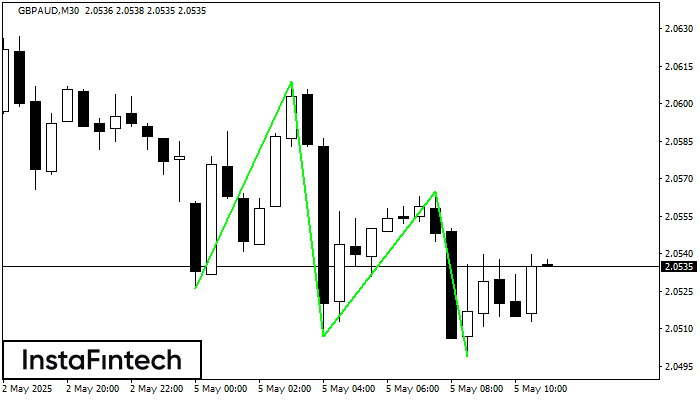
The Triple Bottom pattern has formed on the chart of GBPAUD M30. Features of the pattern: The lower line of the pattern has coordinates 2.0609 with the upper limit 2.0609/2.0565
Open chart in a new window
Double Top
was formed on 05.05 at 09:45:08 (UTC+0)
signal strength 1 of 5
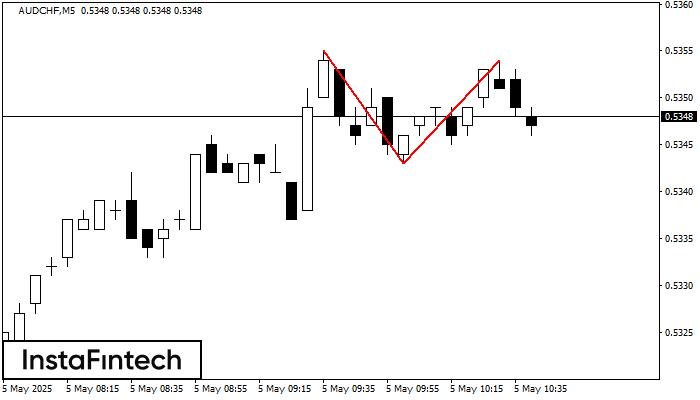
The Double Top reversal pattern has been formed on AUDCHF M5. Characteristics: the upper boundary 0.5355; the lower boundary 0.5343; the width of the pattern is 11 points. Sell trades
The M5 and M15 time frames may have more false entry points.
Open chart in a new window


