

Өзекті паттерндер

Перевернутая голова и плечи
сформирован 09.04 в 15:29:43 (UTC+0)
сила сигнала 3 из 5
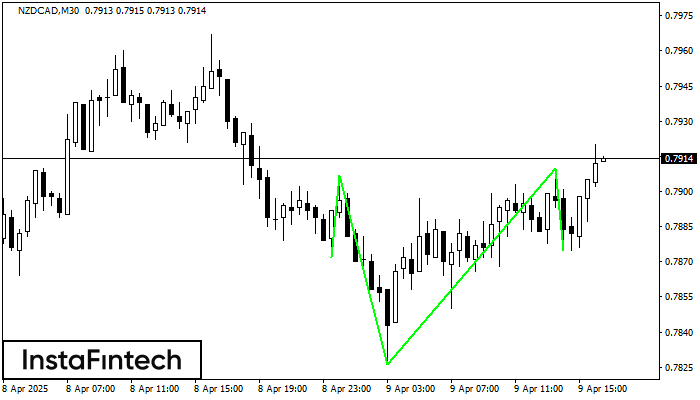
По NZDCAD на M30 сформировалась фигура «Перевернутая голова и плечи». Вершина головы закреплена на 0.7910, при этом средняя линия шеи расположена на 0.7826/0.7875. Формирование фигуры «Перевернутая голова и плечи» наиболее вероятным образом свидетельствует о развороте восходящего тренда. Это означает, что курс NZDCAD, в случае срабатывания фигуры, пойдет в направлении 0.7940 (20 - 40 пунктов).
Сондай-ақ қараңыз
- Все
- Все
- Bearish Rectangle
- Bearish Symmetrical Triangle
- Bearish Symmetrical Triangle
- Bullish Rectangle
- Double Top
- Double Top
- Triple Bottom
- Triple Bottom
- Triple Top
- Triple Top
- Все
- Все
- Покупка
- Продажа
- Все
- 1
- 2
- 3
- 4
- 5
Bearish Rectangle
сформирован 05.05 в 18:28:29 (UTC+0)
сила сигнала 1 из 5
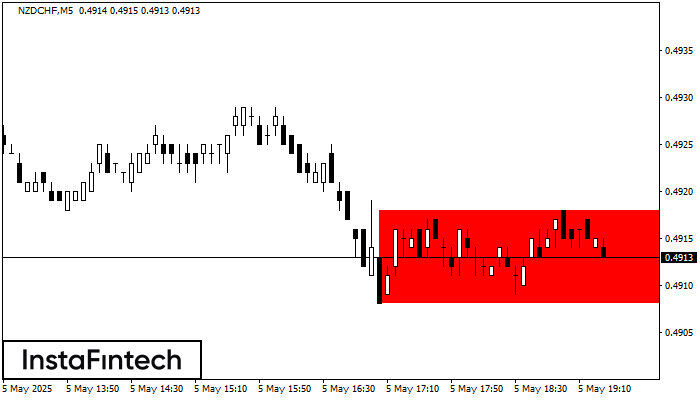
According to the chart of M5, NZDCHF formed the Bearish Rectangle. This type of a pattern indicates a trend continuation. It consists of two levels: resistance 0.4918 - 0.0000
The M5 and M15 time frames may have more false entry points.
Открыть график инструмента в новом окне
Bullish Symmetrical Triangle
сформирован 05.05 в 18:05:07 (UTC+0)
сила сигнала 1 из 5
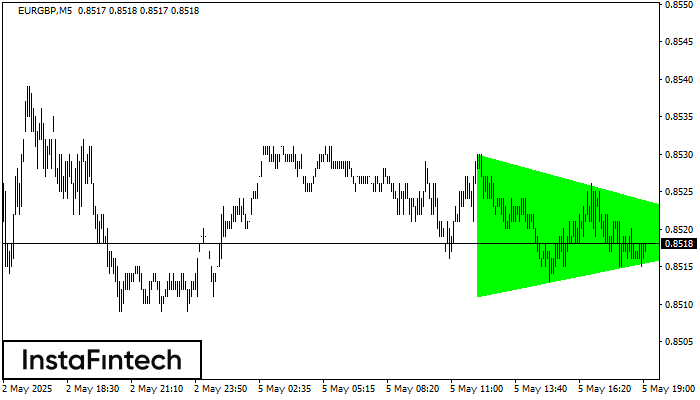
According to the chart of M5, EURGBP formed the Bullish Symmetrical Triangle pattern. The lower border of the pattern touches the coordinates 0.8511/0.8519 whereas the upper border goes across 0.8530/0.8519
The M5 and M15 time frames may have more false entry points.
Открыть график инструмента в новом окне
Double Bottom
сформирован 05.05 в 18:04:57 (UTC+0)
сила сигнала 1 из 5
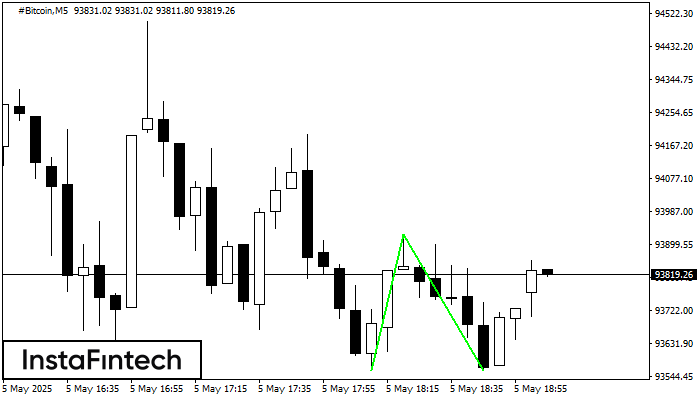
The Double Bottom pattern has been formed on #Bitcoin M5; the upper boundary is 93926.12; the lower boundary is 93560.62. The width of the pattern is 36607 points. In case
The M5 and M15 time frames may have more false entry points.
Открыть график инструмента в новом окне


