

Өзекті паттерндер

Двойная вершина
сформирован 08.04 в 07:55:14 (UTC+0)
сила сигнала 1 из 5
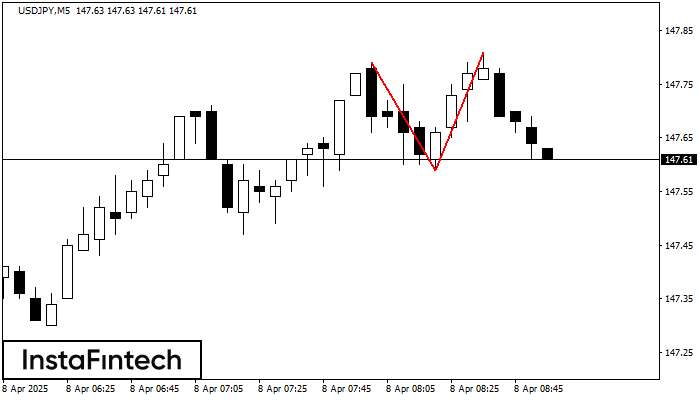
На торговом графике USDJPY M5 сформировалась разворотная фигура «Двойная вершина». Характеристика: Верхняя граница 147.81; Нижняя граница 147.59; Ширина фигуры 22 пунктов. Сигнал: Пробой нижней границы 147.59 приведет к дальнейшему нисходящему движению с перспективой хода к уровню 147.44.
Таймфреймы М5 и М15 могут иметь больше ложных точек входа.
Сондай-ақ қараңыз
- Все
- Все
- Bearish Rectangle
- Bearish Symmetrical Triangle
- Bearish Symmetrical Triangle
- Bullish Rectangle
- Double Top
- Double Top
- Triple Bottom
- Triple Bottom
- Triple Top
- Triple Top
- Все
- Все
- Покупка
- Продажа
- Все
- 1
- 2
- 3
- 4
- 5
Double Bottom
сформирован 06.05 в 13:10:34 (UTC+0)
сила сигнала 1 из 5
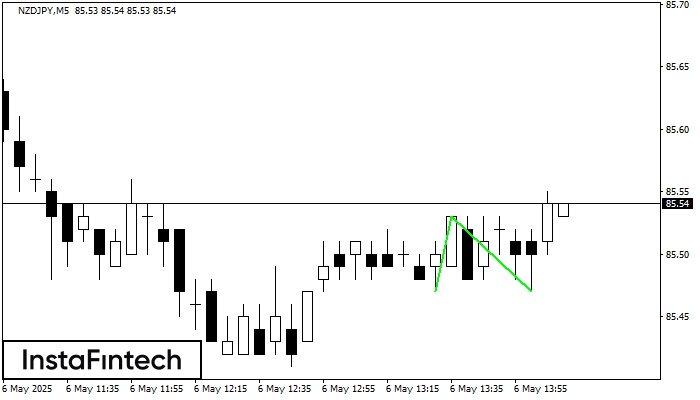
The Double Bottom pattern has been formed on NZDJPY M5. This formation signals a reversal of the trend from downwards to upwards. The signal is that a buy trade should
The M5 and M15 time frames may have more false entry points.
Открыть график инструмента в новом окне
Triple Bottom
сформирован 06.05 в 12:10:30 (UTC+0)
сила сигнала 1 из 5
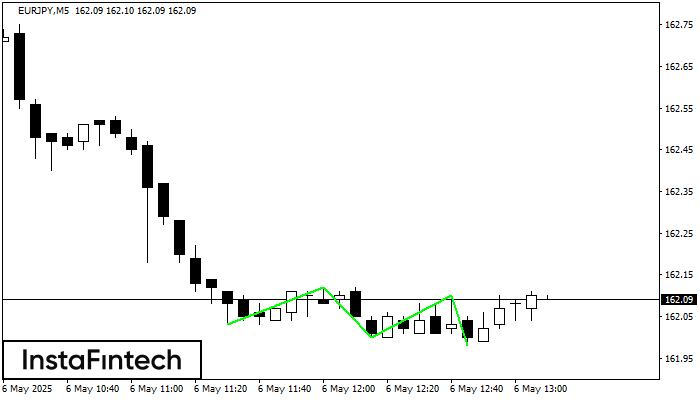
The Triple Bottom pattern has formed on the chart of EURJPY M5. Features of the pattern: The lower line of the pattern has coordinates 162.12 with the upper limit 162.12/162.10
The M5 and M15 time frames may have more false entry points.
Открыть график инструмента в новом окне
Bullish Rectangle
сформирован 06.05 в 11:35:27 (UTC+0)
сила сигнала 1 из 5

According to the chart of M5, NZDCHF formed the Bullish Rectangle which is a pattern of a trend continuation. The pattern is contained within the following borders: the lower border
The M5 and M15 time frames may have more false entry points.
Открыть график инструмента в новом окне


