

Өзекті паттерндер

Медвежий симметричный треугольник
сформирован 07.04 в 22:30:31 (UTC+0)
сила сигнала 1 из 5
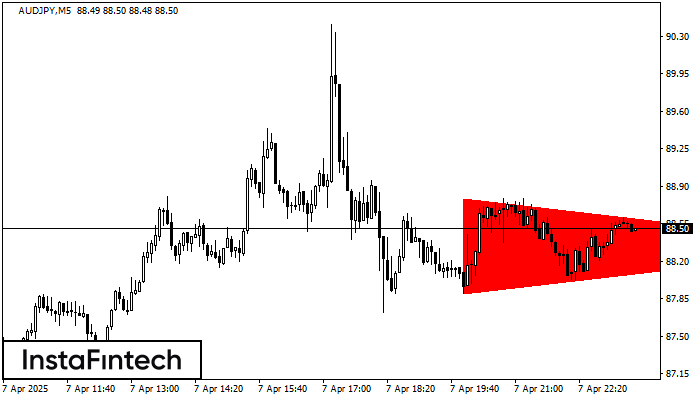
На графике AUDJPY на M5 сформировалась фигура «Медвежий симметричный треугольник». Торговые рекомендации: Пробой нижней границы 87.90 с большой долей вероятности приведет к продолжению нисходящего тренда.
Таймфреймы М5 и М15 могут иметь больше ложных точек входа.
Сондай-ақ қараңыз
- Все
- Все
- Bearish Rectangle
- Bearish Symmetrical Triangle
- Bearish Symmetrical Triangle
- Bullish Rectangle
- Double Top
- Double Top
- Triple Bottom
- Triple Bottom
- Triple Top
- Triple Top
- Все
- Все
- Покупка
- Продажа
- Все
- 1
- 2
- 3
- 4
- 5
Triple Bottom
сформирован 08.05 в 19:55:21 (UTC+0)
сила сигнала 1 из 5
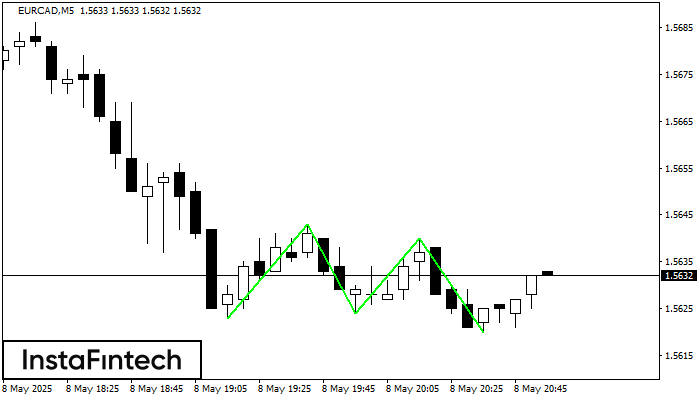
The Triple Bottom pattern has formed on the chart of the EURCAD M5 trading instrument. The pattern signals a change in the trend from downwards to upwards in the case
The M5 and M15 time frames may have more false entry points.
Открыть график инструмента в новом окне
Double Top
сформирован 08.05 в 19:50:48 (UTC+0)
сила сигнала 1 из 5
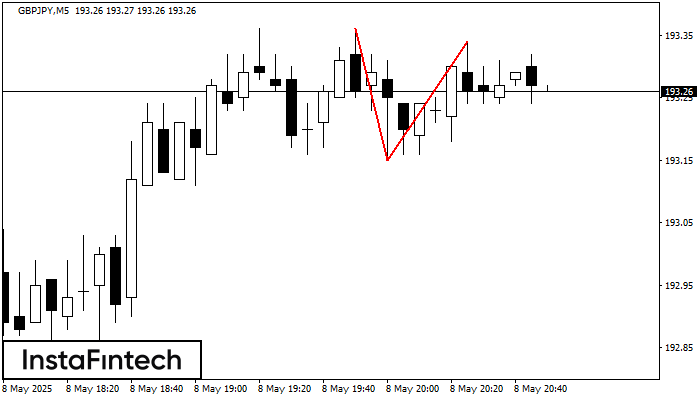
The Double Top reversal pattern has been formed on GBPJPY M5. Characteristics: the upper boundary 193.36; the lower boundary 193.15; the width of the pattern is 19 points. Sell trades
The M5 and M15 time frames may have more false entry points.
Открыть график инструмента в новом окне
Double Bottom
сформирован 08.05 в 19:50:44 (UTC+0)
сила сигнала 1 из 5
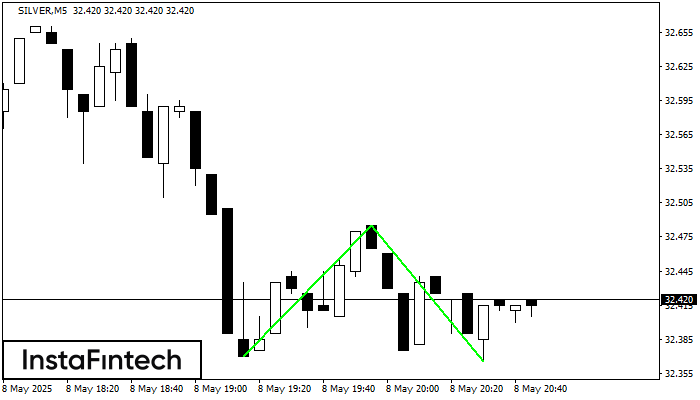
The Double Bottom pattern has been formed on SILVER M5; the upper boundary is 32.48; the lower boundary is 32.37. The width of the pattern is 115 points. In case
The M5 and M15 time frames may have more false entry points.
Открыть график инструмента в новом окне


