

Өзекті паттерндер

Двойная вершина
сформирован 07.04 в 14:20:08 (UTC+0)
сила сигнала 1 из 5
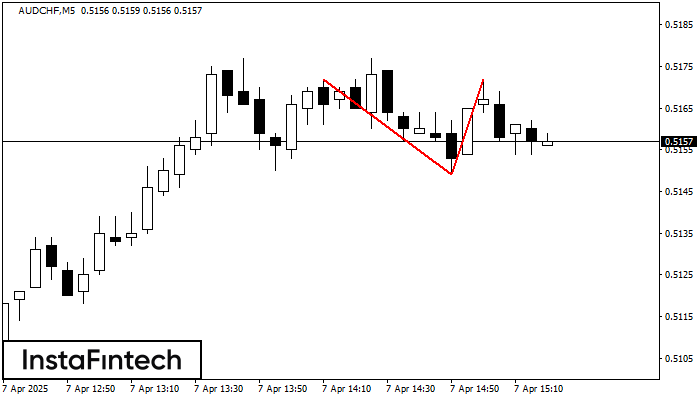
По торговому инструменту AUDCHF на M5 сформировалась фигура «Двойная вершина», которая сигнализирует нам об изменении тенденции с восходящей на нисходящую. Вероятно, что, в случае пробоя основания фигуры 0.5149, возможно дальнейшее нисходящее движение.
Таймфреймы М5 и М15 могут иметь больше ложных точек входа.
- Все
- Все
- Bearish Rectangle
- Bearish Symmetrical Triangle
- Bearish Symmetrical Triangle
- Bullish Rectangle
- Double Top
- Double Top
- Triple Bottom
- Triple Bottom
- Triple Top
- Triple Top
- Все
- Все
- Покупка
- Продажа
- Все
- 1
- 2
- 3
- 4
- 5
Double Bottom
сформирован 22.04 в 07:00:30 (UTC+0)
сила сигнала 1 из 5
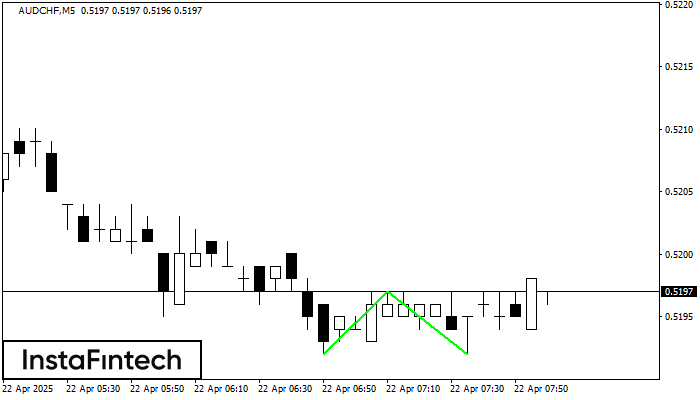
The Double Bottom pattern has been formed on AUDCHF M5; the upper boundary is 0.5197; the lower boundary is 0.5192. The width of the pattern is 5 points. In case
The M5 and M15 time frames may have more false entry points.
Открыть график инструмента в новом окне
Double Top
сформирован 22.04 в 06:46:04 (UTC+0)
сила сигнала 1 из 5
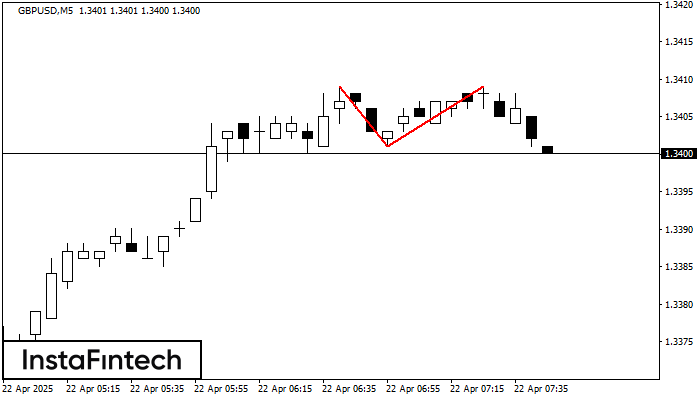
On the chart of GBPUSD M5 the Double Top reversal pattern has been formed. Characteristics: the upper boundary 1.3409; the lower boundary 1.3401; the width of the pattern 8 points
The M5 and M15 time frames may have more false entry points.
Открыть график инструмента в новом окне
Bearish Rectangle
сформирован 22.04 в 06:31:47 (UTC+0)
сила сигнала 1 из 5
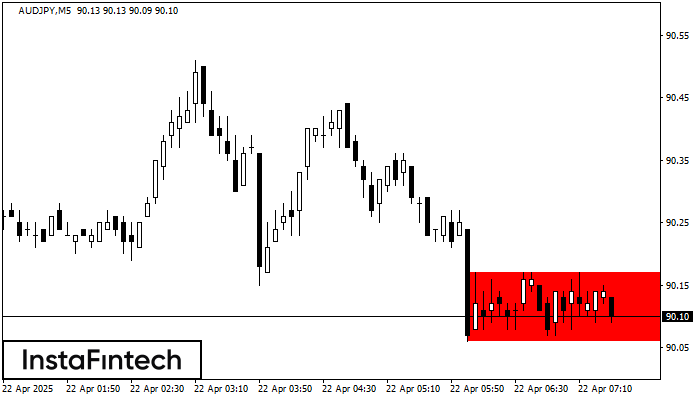
According to the chart of M5, AUDJPY formed the Bearish Rectangle. This type of a pattern indicates a trend continuation. It consists of two levels: resistance 90.17 - 0.00
The M5 and M15 time frames may have more false entry points.
Открыть график инструмента в новом окне


