

Өзекті паттерндер

Прямоугольник
сформирован 07.04 в 00:36:44 (UTC+0)
сила сигнала 1 из 5
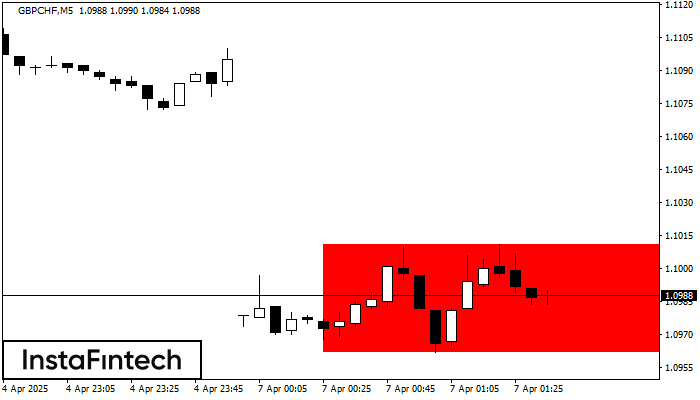
Сформирована фигура «Прямоугольник» на графике GBPCHF M5. Тип фигуры: Продолжение тренда; Границы: Верхняя 1.1011, Нижняя 1.0962; Сигнал: позиция на продажу открывается после фиксации цены ниже границы прямоугольника 1.0962.
Таймфреймы М5 и М15 могут иметь больше ложных точек входа.
Сондай-ақ қараңыз
- Все
- Все
- Bearish Rectangle
- Bearish Symmetrical Triangle
- Bearish Symmetrical Triangle
- Bullish Rectangle
- Double Top
- Double Top
- Triple Bottom
- Triple Bottom
- Triple Top
- Triple Top
- Все
- Все
- Покупка
- Продажа
- Все
- 1
- 2
- 3
- 4
- 5
Double Bottom
сформирован 21.04 в 02:15:11 (UTC+0)
сила сигнала 2 из 5
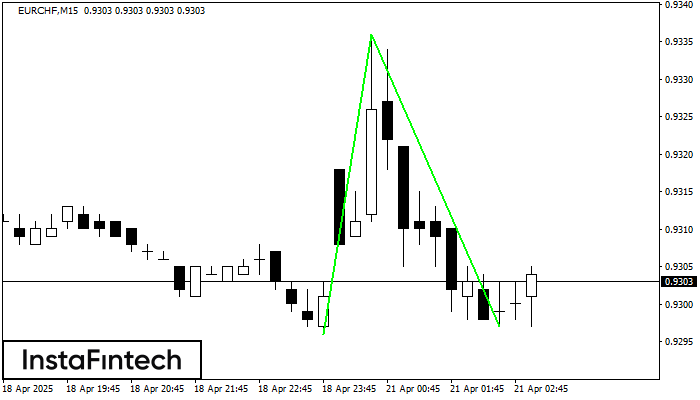
The Double Bottom pattern has been formed on EURCHF M15. Characteristics: the support level 0.9296; the resistance level 0.9336; the width of the pattern 40 points. If the resistance level
The M5 and M15 time frames may have more false entry points.
Открыть график инструмента в новом окне
Double Top
сформирован 21.04 в 02:05:24 (UTC+0)
сила сигнала 1 из 5
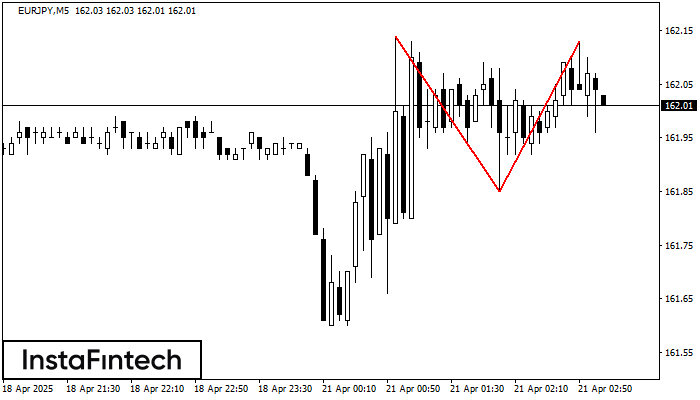
The Double Top pattern has been formed on EURJPY M5. It signals that the trend has been changed from upwards to downwards. Probably, if the base of the pattern 161.85
The M5 and M15 time frames may have more false entry points.
Открыть график инструмента в новом окне
Double Bottom
сформирован 21.04 в 01:55:14 (UTC+0)
сила сигнала 1 из 5
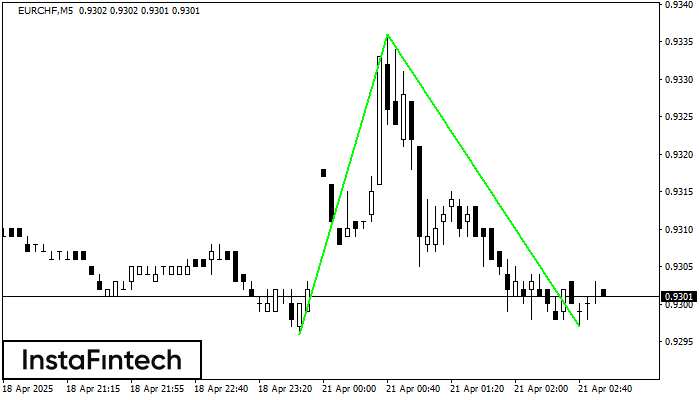
The Double Bottom pattern has been formed on EURCHF M5. Characteristics: the support level 0.9296; the resistance level 0.9336; the width of the pattern 40 points. If the resistance level
The M5 and M15 time frames may have more false entry points.
Открыть график инструмента в новом окне


