

Өзекті паттерндер

Двойное дно
сформирован 04.04 в 20:00:33 (UTC+0)
сила сигнала 3 из 5
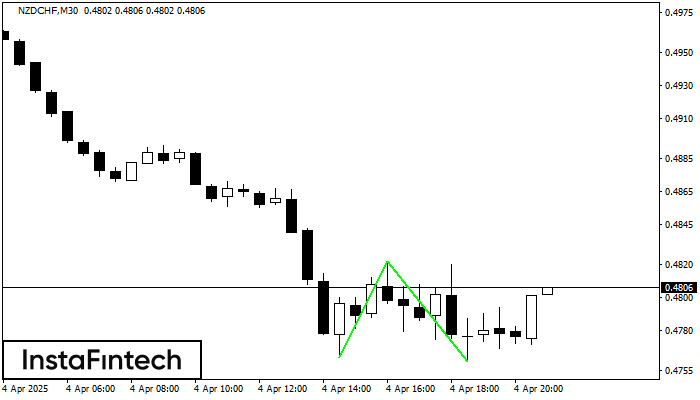
Сформирована фигура «Двойное дно» на графике NZDCHF M30. Данное формирование сигнализирует об изменении тенденции с нисходящего на восходящее движение. Сигнал: Торговую позицию на покупку следует открывать после пробоя верхней границы фигуры 0.4822, где перспектива будущего хода будет являться шириной текущей фигуры - 59 пунктов.
- Все
- Все
- Bearish Rectangle
- Bearish Symmetrical Triangle
- Bearish Symmetrical Triangle
- Bullish Rectangle
- Double Top
- Double Top
- Triple Bottom
- Triple Bottom
- Triple Top
- Triple Top
- Все
- Все
- Покупка
- Продажа
- Все
- 1
- 2
- 3
- 4
- 5
Double Top
was formed on 13.05 at 10:25:03 (UTC+0)
signal strength 1 of 5
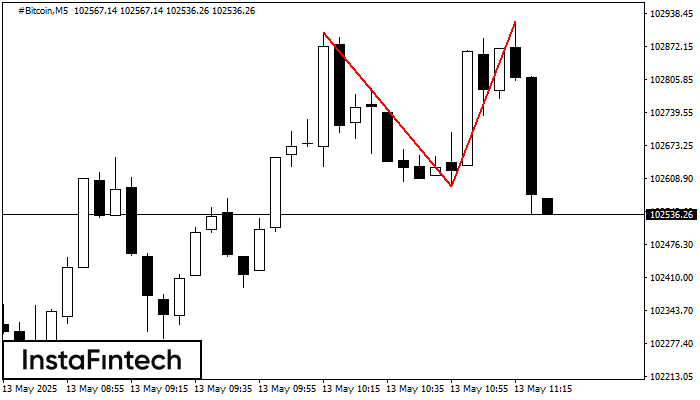
On the chart of #Bitcoin M5 the Double Top reversal pattern has been formed. Characteristics: the upper boundary 102921.94; the lower boundary 102591.19; the width of the pattern 33075 points
The M5 and M15 time frames may have more false entry points.
Open chart in a new window
Triple Bottom
was formed on 13.05 at 09:59:46 (UTC+0)
signal strength 4 of 5
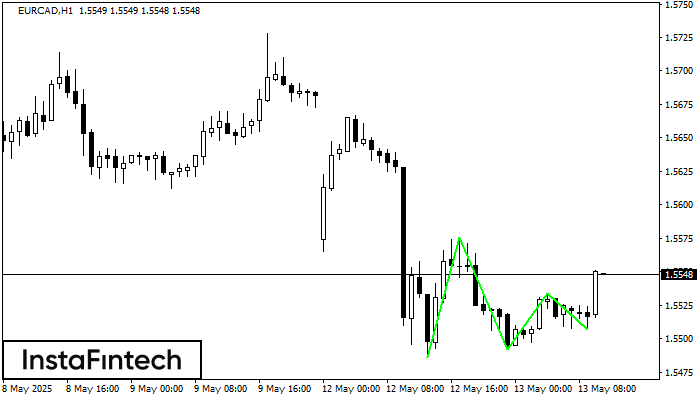
The Triple Bottom pattern has been formed on EURCAD H1. It has the following characteristics: resistance level 1.5576/1.5534; support level 1.5486/1.5507; the width is 90 points. In the event
Open chart in a new window
Double Top
was formed on 13.05 at 09:30:04 (UTC+0)
signal strength 1 of 5
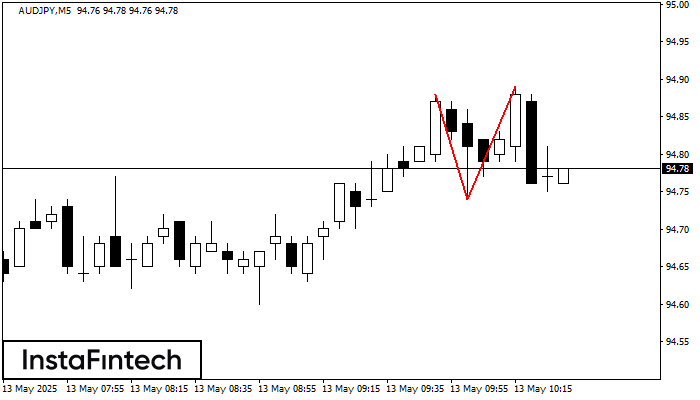
The Double Top reversal pattern has been formed on AUDJPY M5. Characteristics: the upper boundary 94.88; the lower boundary 94.74; the width of the pattern is 15 points. Sell trades
The M5 and M15 time frames may have more false entry points.
Open chart in a new window


