

Өзекті паттерндер

Двойное дно
сформирован 04.04 в 17:00:23 (UTC+0)
сила сигнала 2 из 5
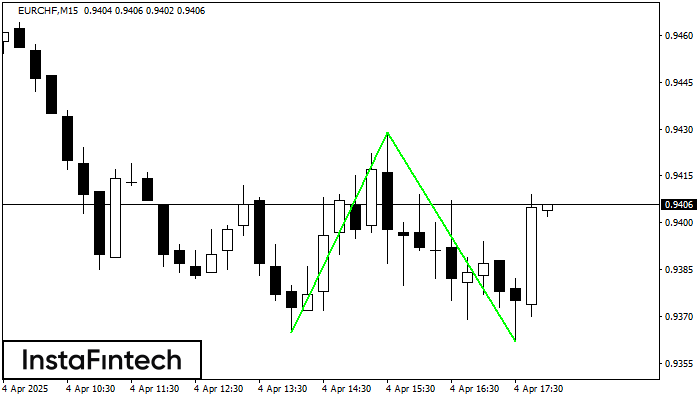
Сформирована фигура «Двойное дно» на графике EURCHF M15. Характеристика: Уровень поддержки 0.9365; Уровень сопротивления 0.9429; Ширина фигуры 64 пунктов. В случае пробоя уровня сопротивления можно будет прогнозировать изменение тенденции, где первая точка фиксации прибыли находится на расстоянии 67 пунктов.
Таймфреймы М5 и М15 могут иметь больше ложных точек входа.
Сондай-ақ қараңыз
- Все
- Все
- Bearish Rectangle
- Bearish Symmetrical Triangle
- Bearish Symmetrical Triangle
- Bullish Rectangle
- Double Top
- Double Top
- Triple Bottom
- Triple Bottom
- Triple Top
- Triple Top
- Все
- Все
- Покупка
- Продажа
- Все
- 1
- 2
- 3
- 4
- 5
Triple Bottom
сформирован 11.05 в 19:05:15 (UTC+0)
сила сигнала 1 из 5
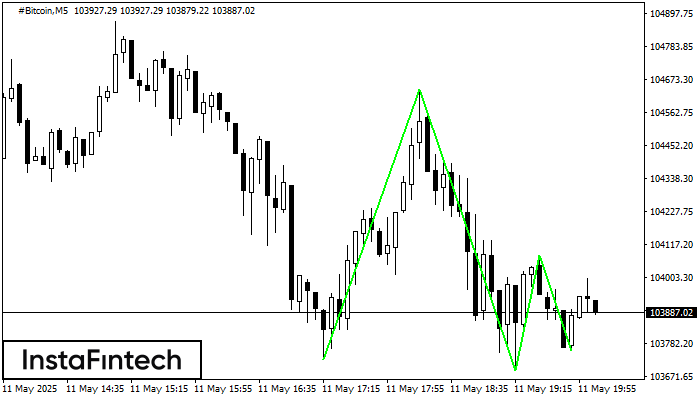
The Triple Bottom pattern has formed on the chart of #Bitcoin M5. Features of the pattern: The lower line of the pattern has coordinates 104640.24 with the upper limit 104640.24/104078.48
The M5 and M15 time frames may have more false entry points.
Открыть график инструмента в новом окне
Double Bottom
сформирован 11.05 в 18:30:15 (UTC+0)
сила сигнала 1 из 5

The Double Bottom pattern has been formed on #Bitcoin M5; the upper boundary is 104640.24; the lower boundary is 103691.15. The width of the pattern is 91343 points. In case
The M5 and M15 time frames may have more false entry points.
Открыть график инструмента в новом окне
Bearish Symmetrical Triangle
сформирован 11.05 в 17:48:22 (UTC+0)
сила сигнала 1 из 5
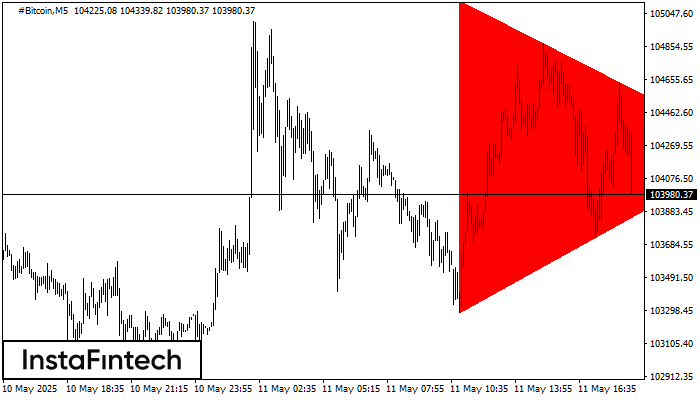
According to the chart of M5, #Bitcoin formed the Bearish Symmetrical Triangle pattern. Description: The lower border is 103283.53/104238.33 and upper border is 105124.26/104238.33. The pattern width is measured
The M5 and M15 time frames may have more false entry points.
Открыть график инструмента в новом окне


