

Өзекті паттерндер

Медвежий вымпел
сформирован 04.04 в 16:10:48 (UTC+0)
сила сигнала 1 из 5
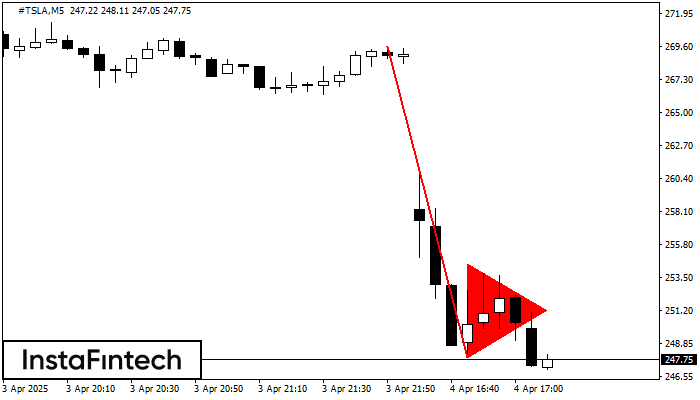
На графике #TSLA M5 сформировалась фигура «Медвежий вымпел», которая сигнализирует о возможном продолжении тренда. Характеристика: основание фигуры имеет координаты 247.91; проекция высоты флагштока равна 2171 пунктов. В случае если цена преодолеет основание фигуры 247.91, то ожидается продолжение нисходящего тренда на уровень 247.76 пунктов.
Таймфреймы М5 и М15 могут иметь больше ложных точек входа.
- Все
- Все
- Bearish Rectangle
- Bearish Symmetrical Triangle
- Bearish Symmetrical Triangle
- Bullish Rectangle
- Double Top
- Double Top
- Triple Bottom
- Triple Bottom
- Triple Top
- Triple Top
- Все
- Все
- Покупка
- Продажа
- Все
- 1
- 2
- 3
- 4
- 5
Bearish Rectangle
was formed on 14.05 at 19:42:39 (UTC+0)
signal strength 1 of 5
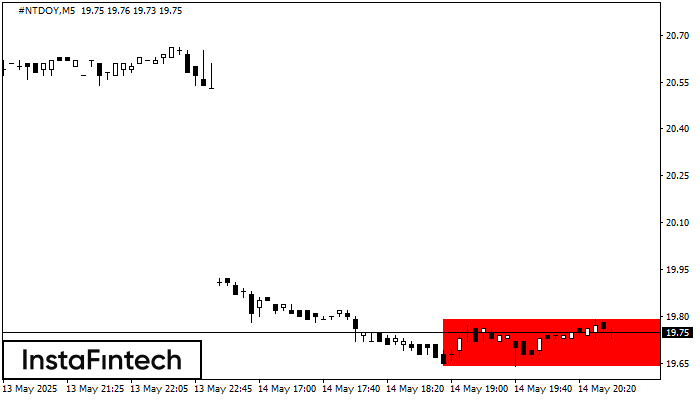
According to the chart of M5, #NTDOY formed the Bearish Rectangle. The pattern indicates a trend continuation. The upper border is 19.79, the lower border is 19.64. The signal means
The M5 and M15 time frames may have more false entry points.
Open chart in a new window
Bearish Rectangle
was formed on 14.05 at 19:42:36 (UTC+0)
signal strength 1 of 5
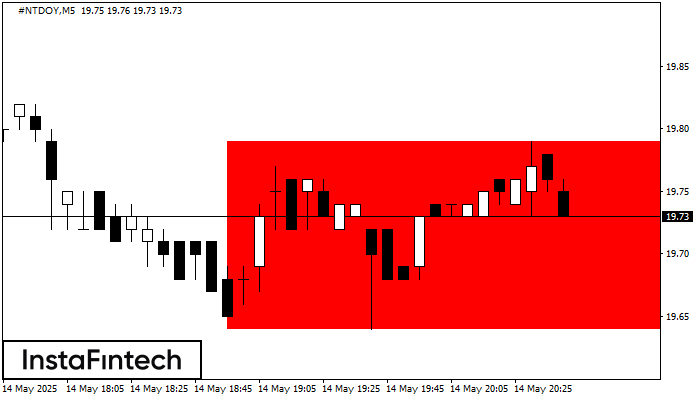
According to the chart of M5, #NTDOY formed the Bearish Rectangle. The pattern indicates a trend continuation. The upper border is 19.79, the lower border is 19.64. The signal means
The M5 and M15 time frames may have more false entry points.
Open chart in a new window
Head and Shoulders
was formed on 14.05 at 19:30:34 (UTC+0)
signal strength 1 of 5

The technical pattern called Head and Shoulders has appeared on the chart of GBPCHF M5. There are weighty reasons to suggest that the price will surpass the Neckline 1.1164/1.1166 after
The M5 and M15 time frames may have more false entry points.
Open chart in a new window


