

Өзекті паттерндер

Прямоугольник
сформирован 04.04 в 12:33:16 (UTC+0)
сила сигнала 4 из 5
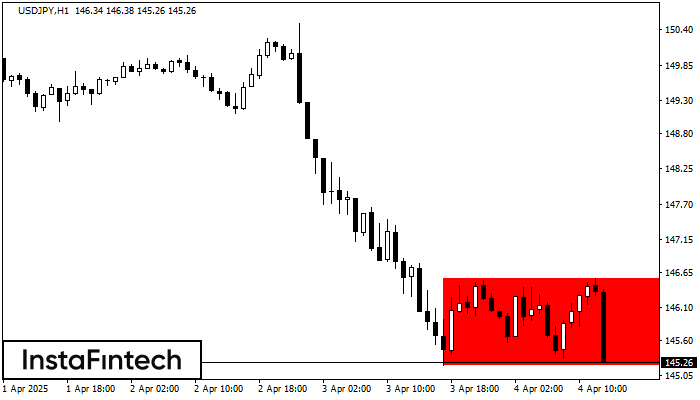
По торговому инструменту USDJPY на H1 сформировалась фигура продолжения тренда - «Прямоугольник». Фигура имеет границы: Нижняя 145.21; Верхняя 146.56. В случае пробоя нижней границы вероятно дальнейшее движение в сторону тренда.
- Все
- Все
- Bearish Rectangle
- Bearish Symmetrical Triangle
- Bearish Symmetrical Triangle
- Bullish Rectangle
- Double Top
- Double Top
- Triple Bottom
- Triple Bottom
- Triple Top
- Triple Top
- Все
- Все
- Покупка
- Продажа
- Все
- 1
- 2
- 3
- 4
- 5
Bullish Rectangle
was formed on 08.05 at 07:42:13 (UTC+0)
signal strength 1 of 5
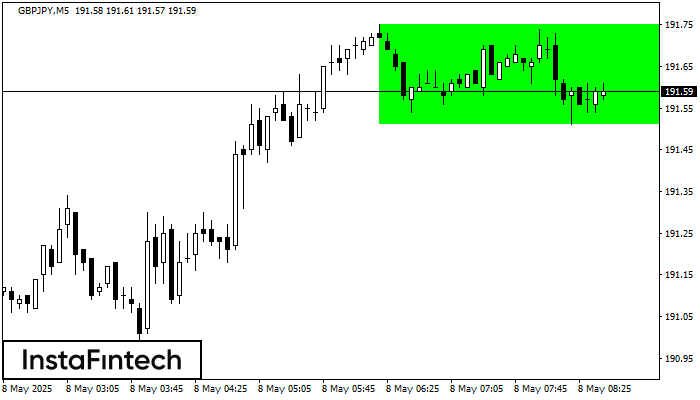
According to the chart of M5, GBPJPY formed the Bullish Rectangle. The pattern indicates a trend continuation. The upper border is 191.75, the lower border is 191.51. The signal means
The M5 and M15 time frames may have more false entry points.
Open chart in a new window
Triple Top
was formed on 08.05 at 07:30:25 (UTC+0)
signal strength 2 of 5
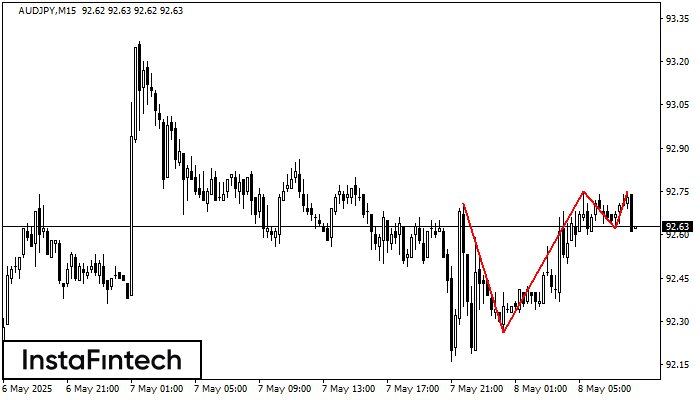
The Triple Top pattern has formed on the chart of the AUDJPY M15 trading instrument. It is a reversal pattern featuring the following characteristics: resistance level -4, support level -36
The M5 and M15 time frames may have more false entry points.
Open chart in a new window
Triple Top
was formed on 08.05 at 07:15:11 (UTC+0)
signal strength 1 of 5
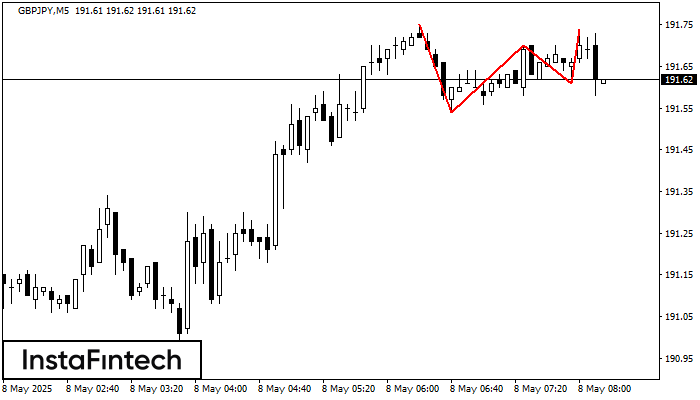
On the chart of the GBPJPY M5 trading instrument, the Triple Top pattern that signals a trend change has formed. It is possible that after formation of the third peak
The M5 and M15 time frames may have more false entry points.
Open chart in a new window


