

Өзекті паттерндер

Прямоугольник
сформирован 04.04 в 04:21:33 (UTC+0)
сила сигнала 2 из 5
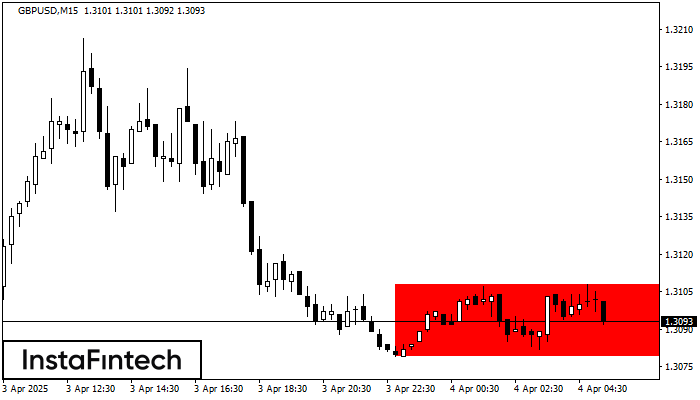
Сформирована фигура «Прямоугольник» на графике GBPUSD M15. Тип фигуры: Продолжение тренда; Границы: Верхняя 1.3108, Нижняя 1.3079; Сигнал: позиция на продажу открывается после фиксации цены ниже границы прямоугольника 1.3079.
Таймфреймы М5 и М15 могут иметь больше ложных точек входа.
Сондай-ақ қараңыз
- Все
- Все
- Bearish Rectangle
- Bearish Symmetrical Triangle
- Bearish Symmetrical Triangle
- Bullish Rectangle
- Double Top
- Double Top
- Triple Bottom
- Triple Bottom
- Triple Top
- Triple Top
- Все
- Все
- Покупка
- Продажа
- Все
- 1
- 2
- 3
- 4
- 5
Bullish Symmetrical Triangle
was formed on 10.04 at 02:15:14 (UTC+0)
signal strength 2 of 5
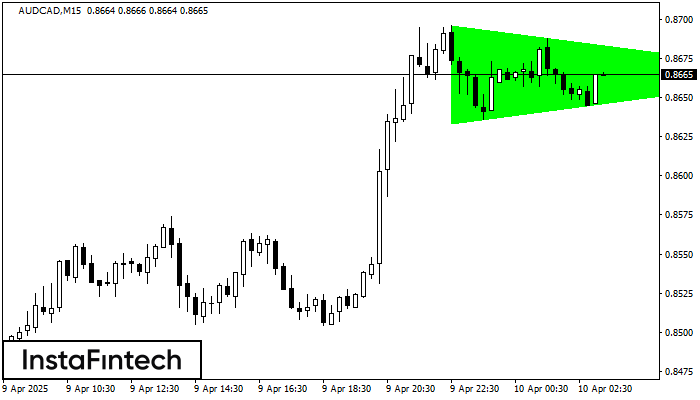
According to the chart of M15, AUDCAD formed the Bullish Symmetrical Triangle pattern, which signals the trend will continue. Description. The upper border of the pattern touches the coordinates 0.8696/0.8665
The M5 and M15 time frames may have more false entry points.
Open chart in a new window
Double Bottom
was formed on 10.04 at 01:30:34 (UTC+0)
signal strength 3 of 5
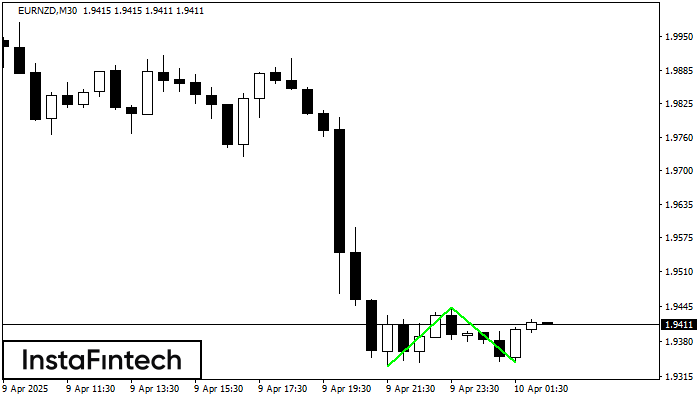
The Double Bottom pattern has been formed on EURNZD M30. This formation signals a reversal of the trend from downwards to upwards. The signal is that a buy trade should
Open chart in a new window
Bullish Rectangle
was formed on 10.04 at 01:02:06 (UTC+0)
signal strength 1 of 5
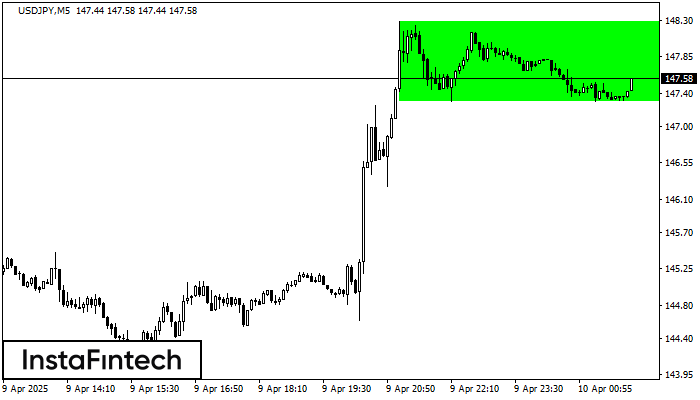
According to the chart of M5, USDJPY formed the Bullish Rectangle. This type of a pattern indicates a trend continuation. It consists of two levels: resistance 148.28 and support 147.30
The M5 and M15 time frames may have more false entry points.
Open chart in a new window


