

Өзекті паттерндер

Медвежий симметричный треугольник
сформирован 04.04 в 02:03:44 (UTC+0)
сила сигнала 3 из 5
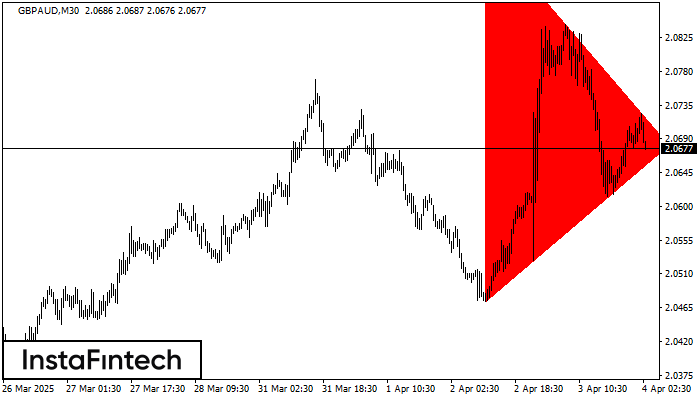
По GBPAUD M30 сформировалась фигура «Медвежий симметричный треугольник». Данная фигура сигнализирует нам о продолжении нисходящего тренда в случае пробоя нижней границы 2.0473, где вероятная прибыль будет являться шириной текущей фигуры -495 пунктов.
- Все
- Все
- Bearish Rectangle
- Bearish Symmetrical Triangle
- Bearish Symmetrical Triangle
- Bullish Rectangle
- Double Top
- Double Top
- Triple Bottom
- Triple Bottom
- Triple Top
- Triple Top
- Все
- Все
- Покупка
- Продажа
- Все
- 1
- 2
- 3
- 4
- 5
Bullish Symmetrical Triangle
сформирован 12.05 в 08:39:25 (UTC+0)
сила сигнала 1 из 5
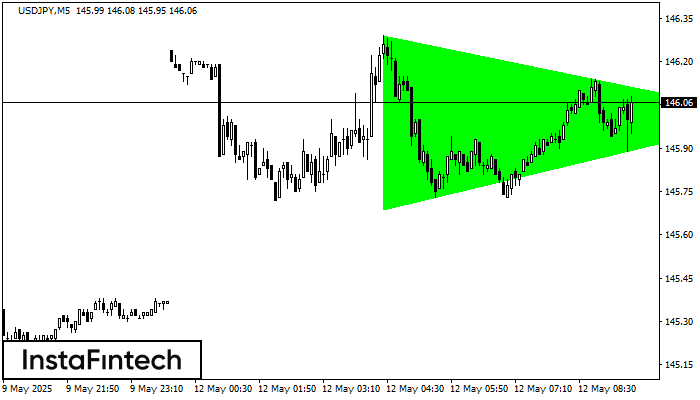
According to the chart of M5, USDJPY formed the Bullish Symmetrical Triangle pattern. The lower border of the pattern touches the coordinates 145.69/146.01 whereas the upper border goes across 146.29/146.01
The M5 and M15 time frames may have more false entry points.
Открыть график инструмента в новом окне
Double Top
сформирован 12.05 в 08:31:02 (UTC+0)
сила сигнала 2 из 5
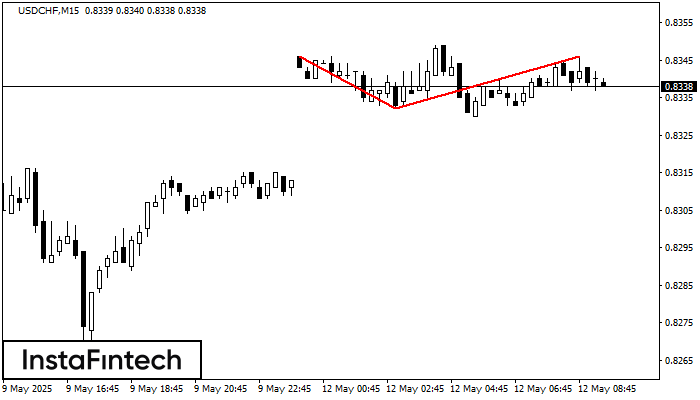
The Double Top reversal pattern has been formed on USDCHF M15. Characteristics: the upper boundary 0.8346; the lower boundary 0.8332; the width of the pattern is 14 points. Sell trades
The M5 and M15 time frames may have more false entry points.
Открыть график инструмента в новом окне
Head and Shoulders
сформирован 12.05 в 08:15:31 (UTC+0)
сила сигнала 2 из 5
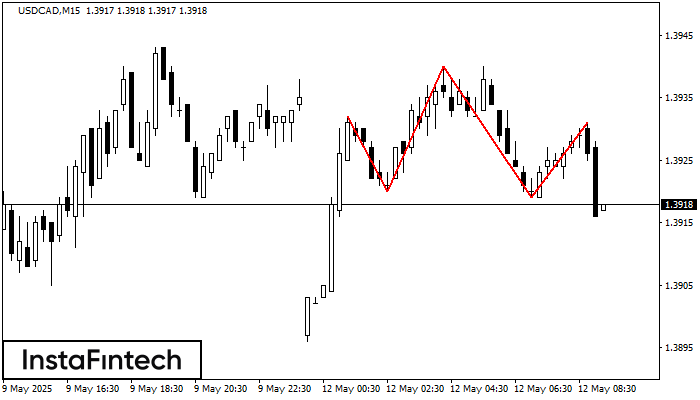
According to the chart of M15, USDCAD formed the Head and Shoulders pattern. The Head’s top is set at 1.3940 while the median line of the Neck is found
The M5 and M15 time frames may have more false entry points.
Открыть график инструмента в новом окне


