

Өзекті паттерндер

Двойное дно
сформирован 03.04 в 08:29:56 (UTC+0)
сила сигнала 3 из 5
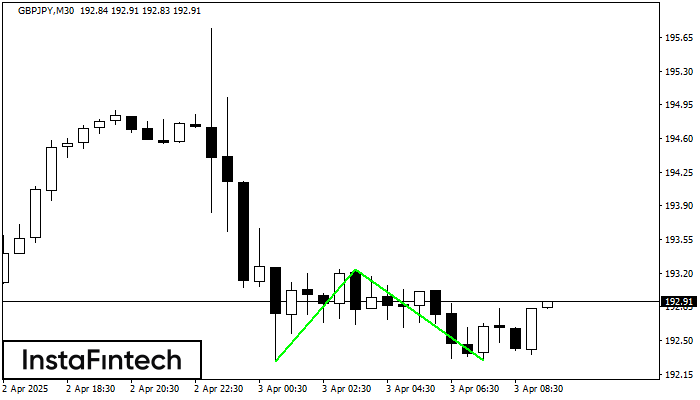
Сформирована фигура «Двойное дно» на графике GBPJPY M30. Верхняя граница 193.24; Нижняя граница 192.29; Ширина фигуры 96 пунктов. В случае пробоя верхней границы 193.24 можно будет прогнозировать изменение тенденции, где ширина фигуры и будет являться расстоянием предположительного Тейк Профита.
Сондай-ақ қараңыз
- Все
- Все
- Bearish Rectangle
- Bearish Symmetrical Triangle
- Bearish Symmetrical Triangle
- Bullish Rectangle
- Double Top
- Double Top
- Triple Bottom
- Triple Bottom
- Triple Top
- Triple Top
- Все
- Все
- Покупка
- Продажа
- Все
- 1
- 2
- 3
- 4
- 5
Triple Bottom
сформирован 26.04 в 07:45:27 (UTC+0)
сила сигнала 2 из 5

The Triple Bottom pattern has formed on the chart of the #Bitcoin M15 trading instrument. The pattern signals a change in the trend from downwards to upwards in the case
The M5 and M15 time frames may have more false entry points.
Открыть график инструмента в новом окне
Double Top
сформирован 25.04 в 22:10:22 (UTC+0)
сила сигнала 1 из 5

The Double Top pattern has been formed on AUDUSD M5. It signals that the trend has been changed from upwards to downwards. Probably, if the base of the pattern 0.6399
The M5 and M15 time frames may have more false entry points.
Открыть график инструмента в новом окне
Double Top
сформирован 25.04 в 22:00:31 (UTC+0)
сила сигнала 2 из 5

On the chart of GBPUSD M15 the Double Top reversal pattern has been formed. Characteristics: the upper boundary 1.3332; the lower boundary 1.3315; the width of the pattern 17 points
The M5 and M15 time frames may have more false entry points.
Открыть график инструмента в новом окне


