

Өзекті паттерндер

Бычий симметричный треугольник
сформирован 03.04 в 00:40:51 (UTC+0)
сила сигнала 1 из 5
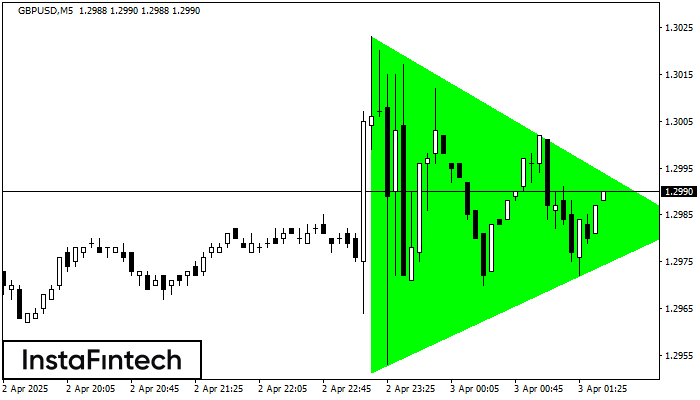
По GBPUSD на M5 фигура «Бычий симметричный треугольник». Характеристика: Фигура продолжения тренда; Координаты границ – верхняя 1.3023, нижняя 1.2951. Проекция ширины фигуры 72 пунктов. Прогноз: В случае пробоя верхней границы 1.3023 цена, вероятнее всего, продолжит движение к 1.2998.
Таймфреймы М5 и М15 могут иметь больше ложных точек входа.
- Все
- Все
- Bearish Rectangle
- Bearish Symmetrical Triangle
- Bearish Symmetrical Triangle
- Bullish Rectangle
- Double Top
- Double Top
- Triple Bottom
- Triple Bottom
- Triple Top
- Triple Top
- Все
- Все
- Покупка
- Продажа
- Все
- 1
- 2
- 3
- 4
- 5
Double Bottom
was formed on 08.05 at 14:10:47 (UTC+0)
signal strength 1 of 5
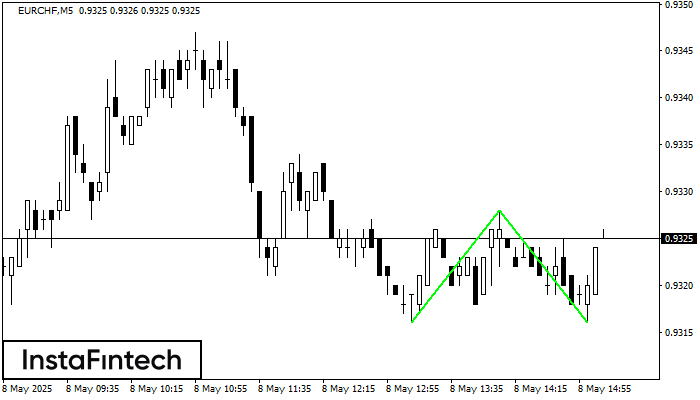
The Double Bottom pattern has been formed on EURCHF M5. Characteristics: the support level 0.9316; the resistance level 0.9328; the width of the pattern 12 points. If the resistance level
The M5 and M15 time frames may have more false entry points.
Open chart in a new window
Triple Bottom
was formed on 08.05 at 12:20:35 (UTC+0)
signal strength 1 of 5

The Triple Bottom pattern has formed on the chart of GBPCHF M5. Features of the pattern: The lower line of the pattern has coordinates 1.0970 with the upper limit 1.0970/1.0964
The M5 and M15 time frames may have more false entry points.
Open chart in a new window
Bullish Flag
was formed on 08.05 at 12:10:56 (UTC+0)
signal strength 2 of 5

The Bullish Flag pattern has been formed on EURJPY at M15. The lower boundary of the pattern is located at 163.36/163.14, while the higher boundary lies at 163.60/163.38. The projection
The M5 and M15 time frames may have more false entry points.
Open chart in a new window


