

Өзекті паттерндер

Двойное дно
сформирован 02.04 в 10:30:25 (UTC+0)
сила сигнала 3 из 5
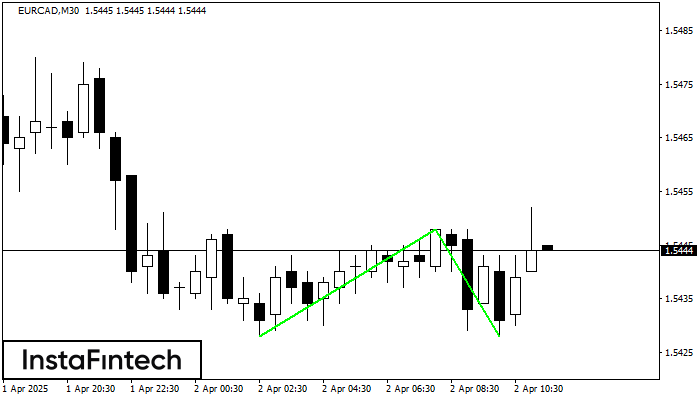
Сформирована фигура «Двойное дно» на графике EURCAD M30. Характеристика: Уровень поддержки 1.5428; Уровень сопротивления 1.5448; Ширина фигуры 20 пунктов. В случае пробоя уровня сопротивления можно будет прогнозировать изменение тенденции, где первая точка фиксации прибыли находится на расстоянии 20 пунктов.
- Все
- Все
- Bearish Rectangle
- Bearish Symmetrical Triangle
- Bearish Symmetrical Triangle
- Bullish Rectangle
- Double Top
- Double Top
- Triple Bottom
- Triple Bottom
- Triple Top
- Triple Top
- Все
- Все
- Покупка
- Продажа
- Все
- 1
- 2
- 3
- 4
- 5
Bullish Symmetrical Triangle
was formed on 12.05 at 18:32:08 (UTC+0)
signal strength 2 of 5
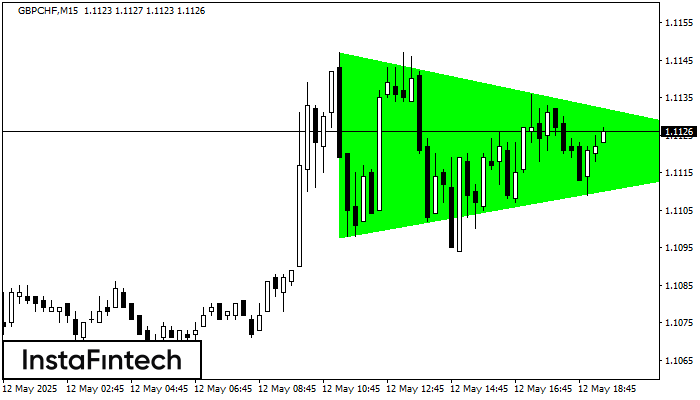
According to the chart of M15, GBPCHF formed the Bullish Symmetrical Triangle pattern, which signals the trend will continue. Description. The upper border of the pattern touches the coordinates 1.1147/1.1120
The M5 and M15 time frames may have more false entry points.
Open chart in a new window
Double Top
was formed on 12.05 at 18:30:24 (UTC+0)
signal strength 1 of 5
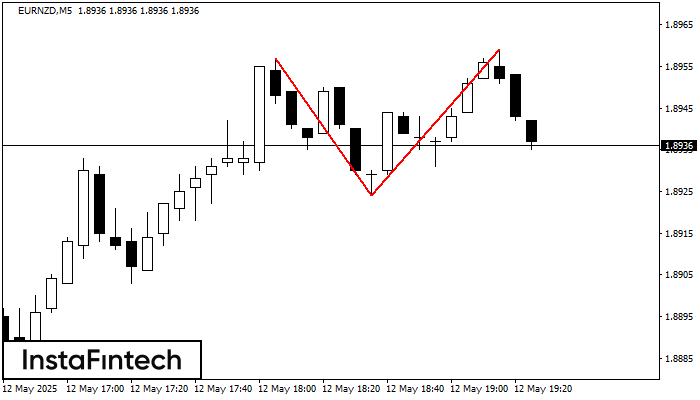
On the chart of EURNZD M5 the Double Top reversal pattern has been formed. Characteristics: the upper boundary 1.8959; the lower boundary 1.8924; the width of the pattern 35 points
The M5 and M15 time frames may have more false entry points.
Open chart in a new window
Bullish Symmetrical Triangle
was formed on 12.05 at 18:18:48 (UTC+0)
signal strength 1 of 5
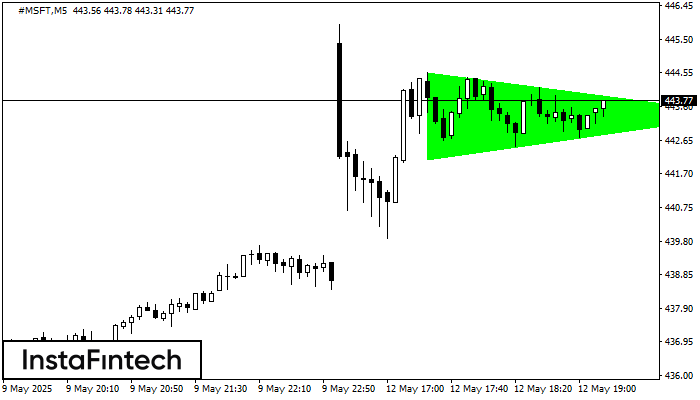
According to the chart of M5, #MSFT formed the Bullish Symmetrical Triangle pattern, which signals the trend will continue. Description. The upper border of the pattern touches the coordinates 444.56/443.38
The M5 and M15 time frames may have more false entry points.
Open chart in a new window


