

Өзекті паттерндер

Двойная вершина
сформирован 02.04 в 09:30:23 (UTC+0)
сила сигнала 3 из 5
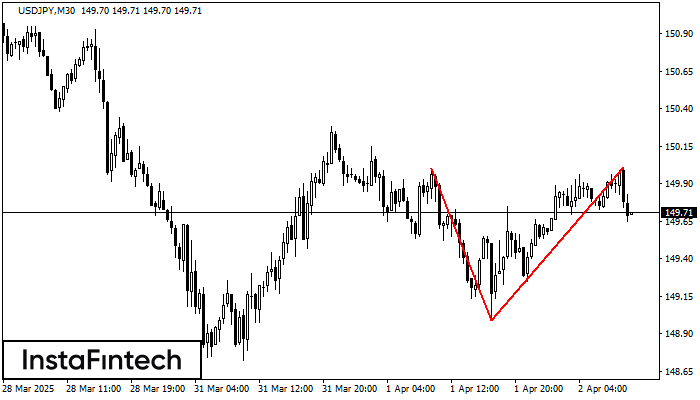
По USDJPY на M30 сформировалась разворотная фигура «Двойная вершина». Характеристика: Верхняя граница 150.00; Нижняя граница 148.99; Ширина фигуры 102 пунктов. Позицию на продажу возможно открыть ниже нижней границы 148.99, с перспективой хода к уровню 148.69.
Сондай-ақ қараңыз
- Все
- Все
- Bearish Rectangle
- Bearish Symmetrical Triangle
- Bearish Symmetrical Triangle
- Bullish Rectangle
- Double Top
- Double Top
- Triple Bottom
- Triple Bottom
- Triple Top
- Triple Top
- Все
- Все
- Покупка
- Продажа
- Все
- 1
- 2
- 3
- 4
- 5
Double Bottom
сформирован 22.04 в 23:05:56 (UTC+0)
сила сигнала 1 из 5
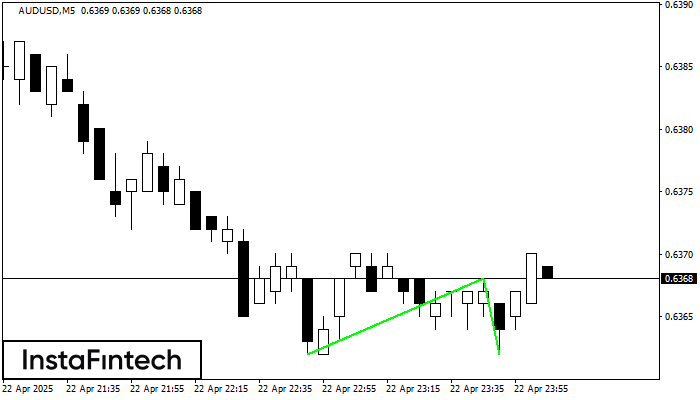
The Double Bottom pattern has been formed on AUDUSD M5; the upper boundary is 0.6368; the lower boundary is 0.6362. The width of the pattern is 6 points. In case
The M5 and M15 time frames may have more false entry points.
Открыть график инструмента в новом окне
Bullish pennant
сформирован 22.04 в 23:00:37 (UTC+0)
сила сигнала 2 из 5
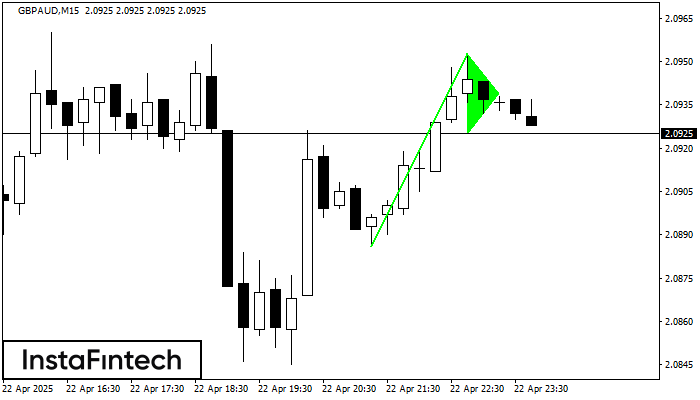
The Bullish pennant signal – Trading instrument GBPAUD M15, continuation pattern. Forecast: it is possible to set up a buy position above the pattern’s high of 2.0953, with the prospect
The M5 and M15 time frames may have more false entry points.
Открыть график инструмента в новом окне
Bullish Rectangle
сформирован 22.04 в 22:14:12 (UTC+0)
сила сигнала 1 из 5

According to the chart of M5, GBPCHF formed the Bullish Rectangle which is a pattern of a trend continuation. The pattern is contained within the following borders: the lower border
The M5 and M15 time frames may have more false entry points.
Открыть график инструмента в новом окне


