

Өзекті паттерндер

Двойная вершина
сформирован 02.04 в 05:00:27 (UTC+0)
сила сигнала 2 из 5
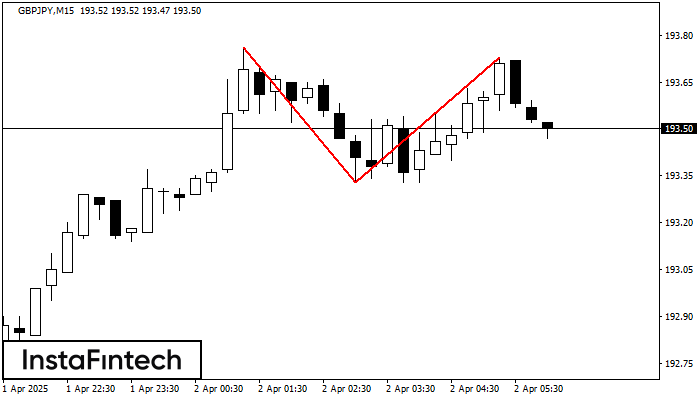
По торговому инструменту GBPJPY на M15 сформировалась фигура «Двойная вершина», которая сигнализирует нам об изменении тенденции с восходящей на нисходящую. Вероятно, что, в случае пробоя основания фигуры 193.33, возможно дальнейшее нисходящее движение.
Таймфреймы М5 и М15 могут иметь больше ложных точек входа.
- Все
- Все
- Bearish Rectangle
- Bearish Symmetrical Triangle
- Bearish Symmetrical Triangle
- Bullish Rectangle
- Double Top
- Double Top
- Triple Bottom
- Triple Bottom
- Triple Top
- Triple Top
- Все
- Все
- Покупка
- Продажа
- Все
- 1
- 2
- 3
- 4
- 5
Bullish Symmetrical Triangle
сформирован 23.04 в 14:40:53 (UTC+0)
сила сигнала 1 из 5
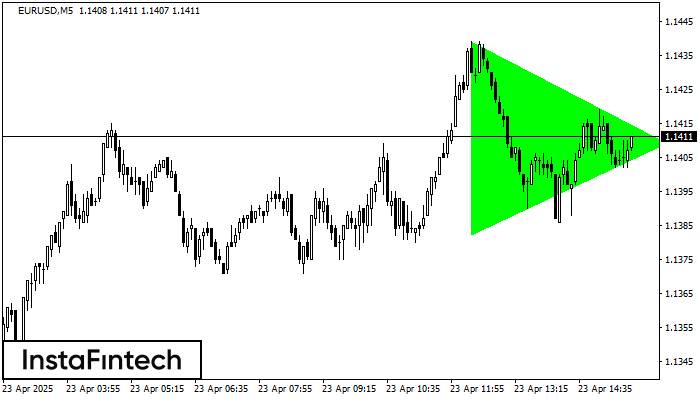
According to the chart of M5, EURUSD formed the Bullish Symmetrical Triangle pattern. The lower border of the pattern touches the coordinates 1.1382/1.1409 whereas the upper border goes across 1.1439/1.1409
The M5 and M15 time frames may have more false entry points.
Открыть график инструмента в новом окне
Bullish Symmetrical Triangle
сформирован 23.04 в 14:34:58 (UTC+0)
сила сигнала 1 из 5
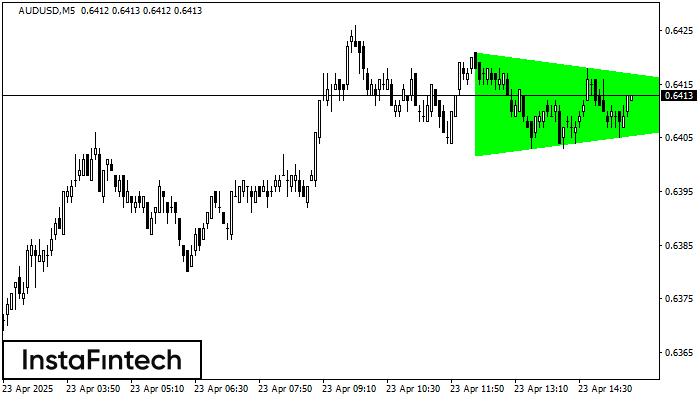
According to the chart of M5, AUDUSD formed the Bullish Symmetrical Triangle pattern. The lower border of the pattern touches the coordinates 0.6402/0.6411 whereas the upper border goes across 0.6421/0.6411
The M5 and M15 time frames may have more false entry points.
Открыть график инструмента в новом окне
Double Bottom
сформирован 23.04 в 14:09:50 (UTC+0)
сила сигнала 1 из 5
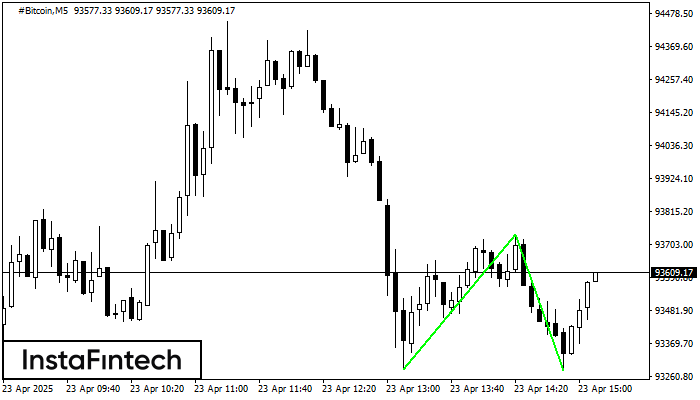
The Double Bottom pattern has been formed on #Bitcoin M5; the upper boundary is 93737.29; the lower boundary is 93280.25. The width of the pattern is 45284 points. In case
The M5 and M15 time frames may have more false entry points.
Открыть график инструмента в новом окне


