

Өзекті паттерндер

Прямоугольник
сформирован 01.04 в 07:00:39 (UTC+0)
сила сигнала 4 из 5
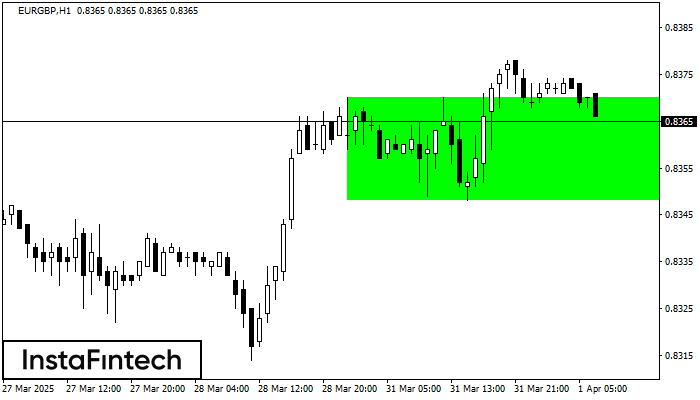
Сформирована фигура «Прямоугольник» на графике EURGBP H1. Тип фигуры: Продолжение тренда; Границы: Верхняя 0.8370, Нижняя 0.8348; Сигнал: позицию на покупку следует открывать выше верхней границы прямоугольника 0.8370.
Сондай-ақ қараңыз
- Все
- Все
- Bearish Rectangle
- Bearish Symmetrical Triangle
- Bearish Symmetrical Triangle
- Bullish Rectangle
- Double Top
- Double Top
- Triple Bottom
- Triple Bottom
- Triple Top
- Triple Top
- Все
- Все
- Покупка
- Продажа
- Все
- 1
- 2
- 3
- 4
- 5
Double Bottom
was formed on 24.04 at 04:31:20 (UTC+0)
signal strength 3 of 5
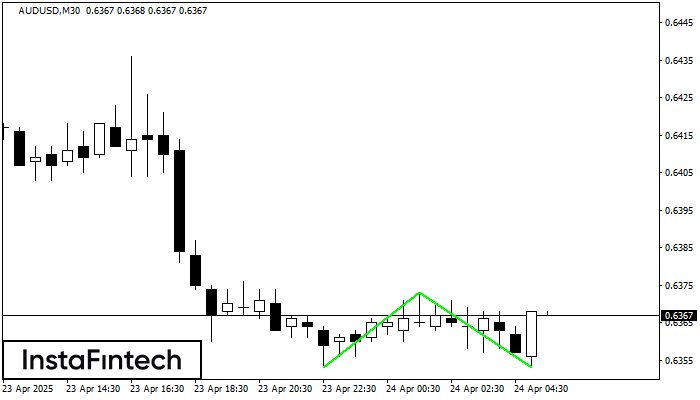
The Double Bottom pattern has been formed on AUDUSD M30. This formation signals a reversal of the trend from downwards to upwards. The signal is that a buy trade should
Open chart in a new window
Double Bottom
was formed on 24.04 at 04:31:17 (UTC+0)
signal strength 2 of 5
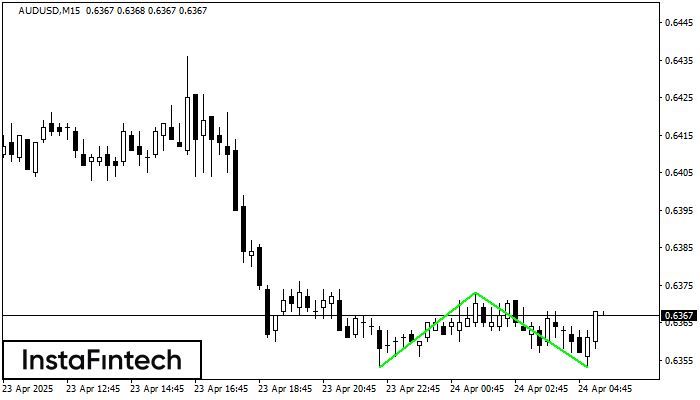
The Double Bottom pattern has been formed on AUDUSD M15; the upper boundary is 0.6373; the lower boundary is 0.6353. The width of the pattern is 20 points. In case
The M5 and M15 time frames may have more false entry points.
Open chart in a new window
Triple Top
was formed on 24.04 at 04:30:21 (UTC+0)
signal strength 3 of 5
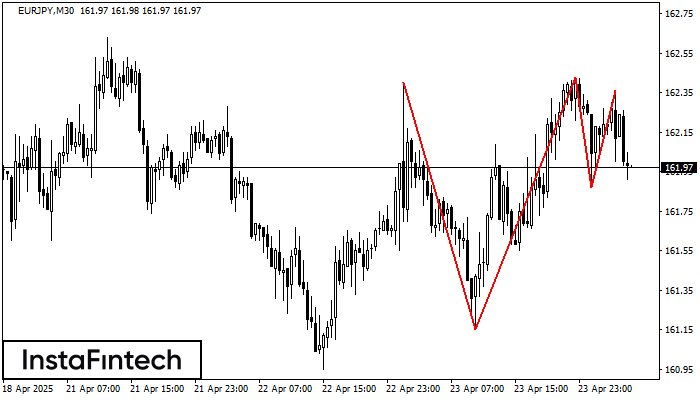
The Triple Top pattern has formed on the chart of the EURJPY M30. Features of the pattern: borders have an ascending angle; the lower line of the pattern
Open chart in a new window


