

Өзекті паттерндер

Двойное дно
сформирован 01.04 в 01:05:27 (UTC+0)
сила сигнала 1 из 5
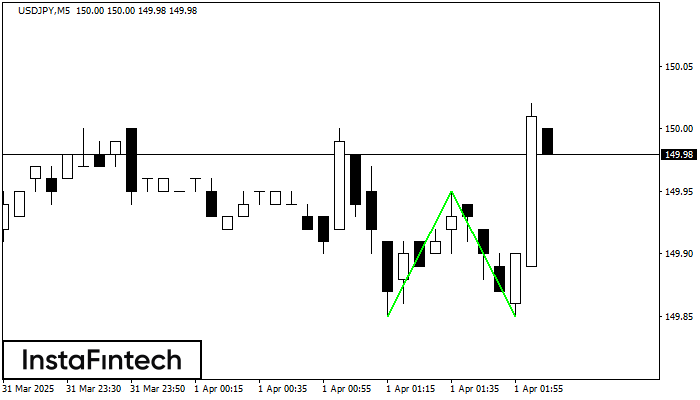
Сформирована фигура «Двойное дно» на графике USDJPY M5. Верхняя граница 149.95; Нижняя граница 149.85; Ширина фигуры 10 пунктов. В случае пробоя верхней границы 149.95 можно будет прогнозировать изменение тенденции, где ширина фигуры и будет являться расстоянием предположительного Тейк Профита.
Таймфреймы М5 и М15 могут иметь больше ложных точек входа.
Сондай-ақ қараңыз
- Все
- Все
- Bearish Rectangle
- Bearish Symmetrical Triangle
- Bearish Symmetrical Triangle
- Bullish Rectangle
- Double Top
- Double Top
- Triple Bottom
- Triple Bottom
- Triple Top
- Triple Top
- Все
- Все
- Покупка
- Продажа
- Все
- 1
- 2
- 3
- 4
- 5
Triple Top
was formed on 08.05 at 19:45:30 (UTC+0)
signal strength 1 of 5
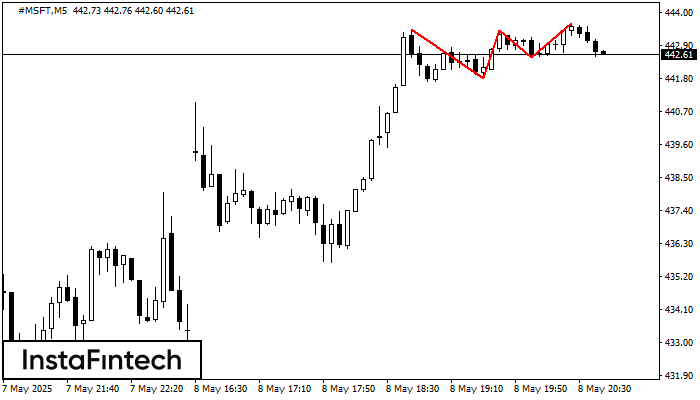
On the chart of the #MSFT M5 trading instrument, the Triple Top pattern that signals a trend change has formed. It is possible that after formation of the third peak
The M5 and M15 time frames may have more false entry points.
Open chart in a new window
Triple Top
was formed on 08.05 at 19:40:27 (UTC+0)
signal strength 1 of 5
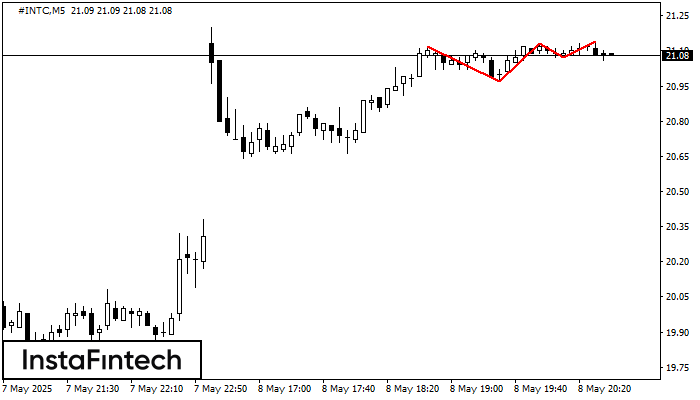
The Triple Top pattern has formed on the chart of the #INTC M5. Features of the pattern: borders have an ascending angle; the lower line of the pattern
The M5 and M15 time frames may have more false entry points.
Open chart in a new window
Bullish Rectangle
was formed on 08.05 at 19:25:47 (UTC+0)
signal strength 1 of 5
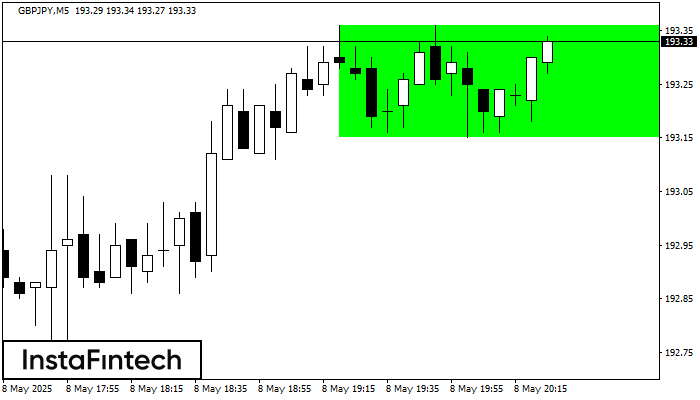
According to the chart of M5, GBPJPY formed the Bullish Rectangle. The pattern indicates a trend continuation. The upper border is 193.36, the lower border is 193.15. The signal means
The M5 and M15 time frames may have more false entry points.
Open chart in a new window


