

Өзекті паттерндер

Медвежий вымпел
сформирован 31.03 в 01:15:38 (UTC+0)
сила сигнала 2 из 5

На графике AUDUSD M15 сформировалась фигура «Медвежий вымпел», которая сигнализирует о возможном продолжении тренда. Характеристика: основание фигуры имеет координаты 0.6272; проекция высоты флагштока равна 19 пунктов. В случае если цена преодолеет основание фигуры 0.6272, то ожидается продолжение нисходящего тренда на уровень 0.6249 пунктов.
Таймфреймы М5 и М15 могут иметь больше ложных точек входа.
Сондай-ақ қараңыз
- Все
- Все
- Bearish Rectangle
- Bearish Symmetrical Triangle
- Bearish Symmetrical Triangle
- Bullish Rectangle
- Double Top
- Double Top
- Triple Bottom
- Triple Bottom
- Triple Top
- Triple Top
- Все
- Все
- Покупка
- Продажа
- Все
- 1
- 2
- 3
- 4
- 5
Double Bottom
сформирован 14.04 в 09:10:12 (UTC+0)
сила сигнала 1 из 5
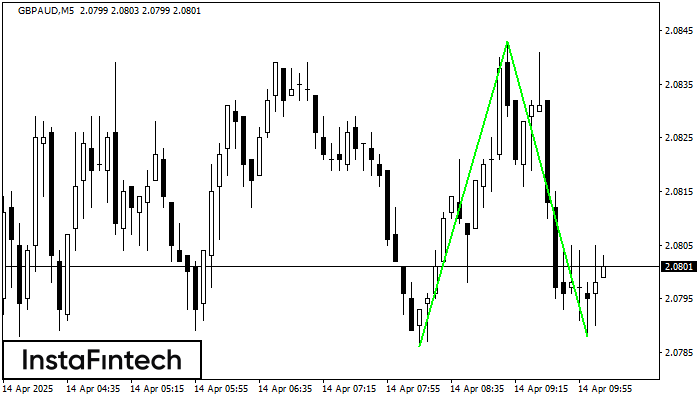
The Double Bottom pattern has been formed on GBPAUD M5. Characteristics: the support level 2.0786; the resistance level 2.0843; the width of the pattern 57 points. If the resistance level
The M5 and M15 time frames may have more false entry points.
Открыть график инструмента в новом окне
Bullish Rectangle
сформирован 14.04 в 08:47:26 (UTC+0)
сила сигнала 1 из 5
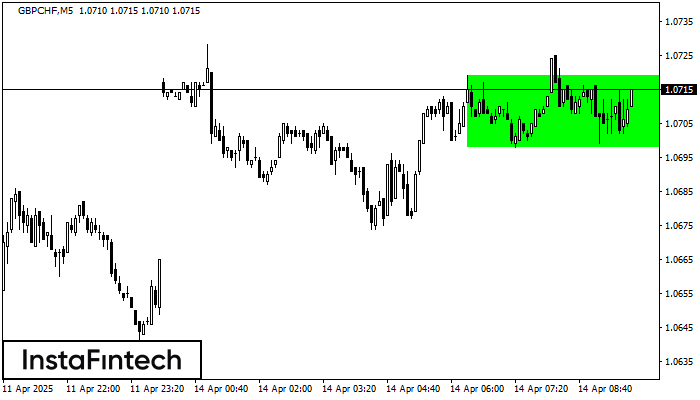
According to the chart of M5, GBPCHF formed the Bullish Rectangle which is a pattern of a trend continuation. The pattern is contained within the following borders: the lower border
The M5 and M15 time frames may have more false entry points.
Открыть график инструмента в новом окне
Triple Bottom
сформирован 14.04 в 08:00:19 (UTC+0)
сила сигнала 2 из 5
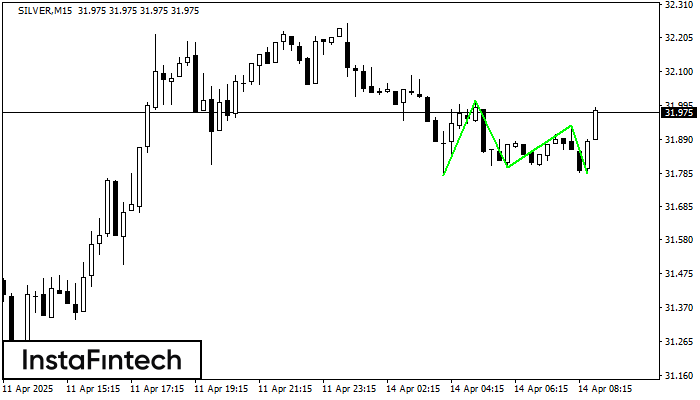
The Triple Bottom pattern has formed on the chart of the SILVER M15 trading instrument. The pattern signals a change in the trend from downwards to upwards in the case
The M5 and M15 time frames may have more false entry points.
Открыть график инструмента в новом окне


