

Өзекті паттерндер

Тройная вершина
сформирован 30.03 в 11:20:04 (UTC+0)
сила сигнала 1 из 5

На графике #Bitcoin M5 образовалась фигура «Тройная вершина». Данная фигура относится к типу разворотных и имеет характеристику: Верхняя граница 83279.90/83362.12; Нижняя граница 82818.73/83017.25; Ширина фигуры 26713 пунктов. Прогноз: В случае пробоя нижней границы 82818.73 вероятно дальнейшее нисходящее движение к уровню 83284.23.
Таймфреймы М5 и М15 могут иметь больше ложных точек входа.
Сондай-ақ қараңыз
- Все
- Все
- Bearish Rectangle
- Bearish Symmetrical Triangle
- Bearish Symmetrical Triangle
- Bullish Rectangle
- Double Top
- Double Top
- Triple Bottom
- Triple Bottom
- Triple Top
- Triple Top
- Все
- Все
- Покупка
- Продажа
- Все
- 1
- 2
- 3
- 4
- 5
Bearish pennant
was formed on 07.05 at 17:02:54 (UTC+0)
signal strength 2 of 5

The Bearish pennant pattern has formed on the #NTDOY M15 chart. It signals potential continuation of the existing trend. Specifications: the pattern’s bottom has the coordinate of 21.38; the projection
The M5 and M15 time frames may have more false entry points.
Open chart in a new window
Bearish pennant
was formed on 07.05 at 17:02:53 (UTC+0)
signal strength 2 of 5
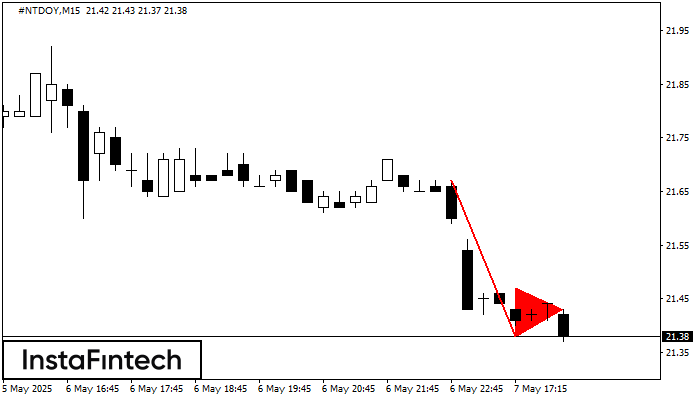
The Bearish pennant pattern has formed on the #NTDOY M15 chart. This pattern type is characterized by a slight slowdown after which the price will move in the direction
The M5 and M15 time frames may have more false entry points.
Open chart in a new window
Bullish Rectangle
was formed on 07.05 at 17:00:15 (UTC+0)
signal strength 3 of 5
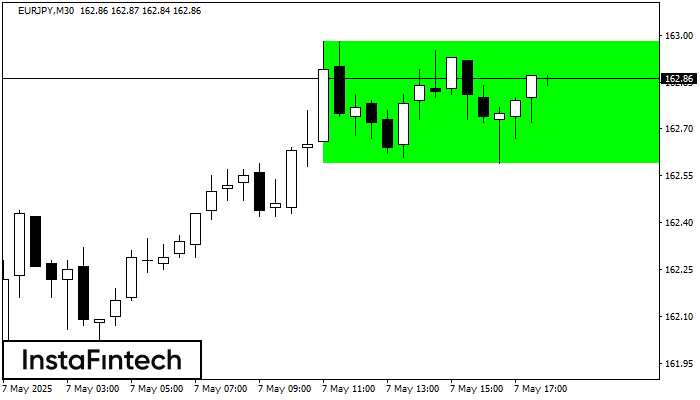
According to the chart of M30, EURJPY formed the Bullish Rectangle. This type of a pattern indicates a trend continuation. It consists of two levels: resistance 162.98 and support 162.59
Open chart in a new window


