

Өзекті паттерндер

Тройное дно
сформирован 28.03 в 20:05:30 (UTC+0)
сила сигнала 1 из 5
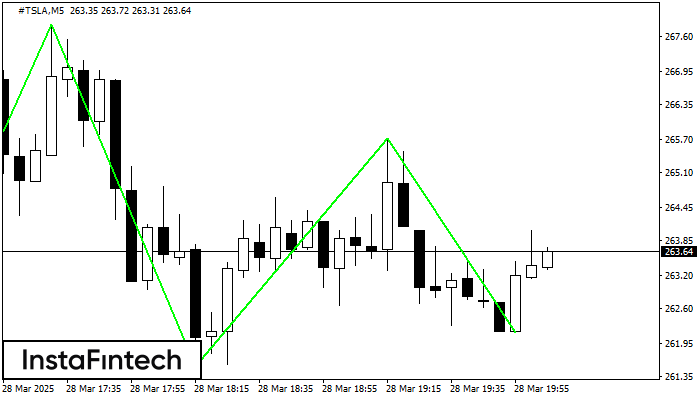
По торговому инструменту #TSLA на M5 была сформирована графическая фигура «Тройное дно» с характеристиками: Уровень сопротивления 265.73; Уровень поддержки 262.15; Ширина 358 пунктов. В случае пробоя уровня сопротивления 267.82 котировка, скорее всего, продолжит восходящее движение как минимум на 629 пунктов.
Таймфреймы М5 и М15 могут иметь больше ложных точек входа.
- Все
- Все
- Bearish Rectangle
- Bearish Symmetrical Triangle
- Bearish Symmetrical Triangle
- Bullish Rectangle
- Double Top
- Double Top
- Triple Bottom
- Triple Bottom
- Triple Top
- Triple Top
- Все
- Все
- Покупка
- Продажа
- Все
- 1
- 2
- 3
- 4
- 5
Bullish Rectangle
was formed on 23.04 at 17:45:08 (UTC+0)
signal strength 1 of 5
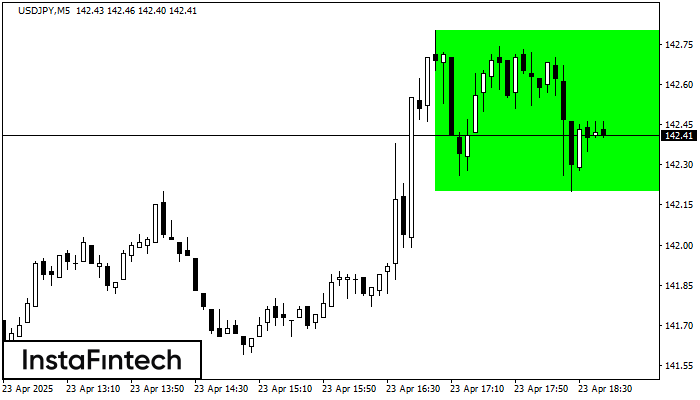
According to the chart of M5, USDJPY formed the Bullish Rectangle which is a pattern of a trend continuation. The pattern is contained within the following borders: the lower border
The M5 and M15 time frames may have more false entry points.
Open chart in a new window
Triple Top
was formed on 23.04 at 17:30:02 (UTC+0)
signal strength 2 of 5
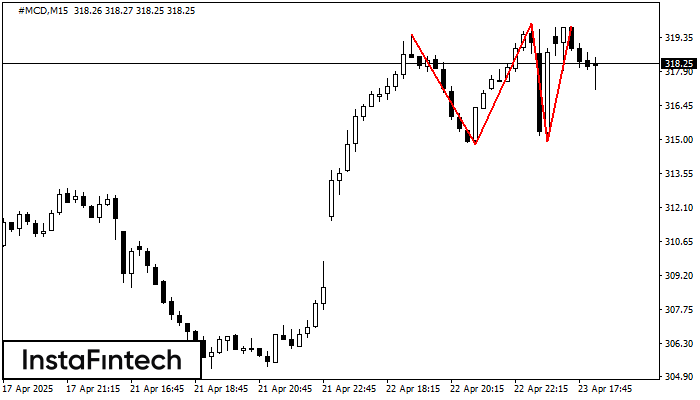
The Triple Top pattern has formed on the chart of the #MCD M15 trading instrument. It is a reversal pattern featuring the following characteristics: resistance level -33, support level -14
The M5 and M15 time frames may have more false entry points.
Open chart in a new window
Triple Top
was formed on 23.04 at 17:24:36 (UTC+0)
signal strength 1 of 5
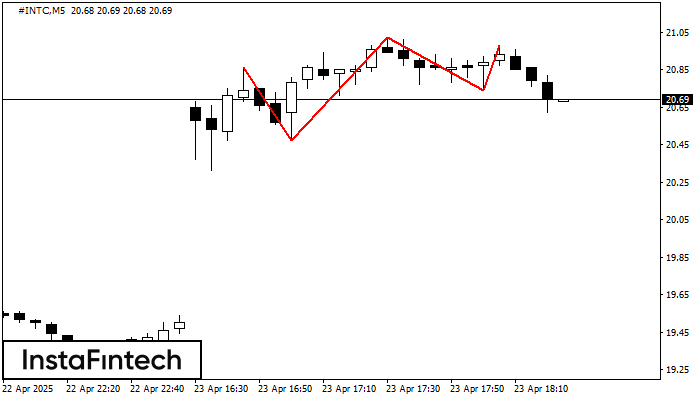
The Triple Top pattern has formed on the chart of the #INTC M5 trading instrument. It is a reversal pattern featuring the following characteristics: resistance level -12, support level -27
The M5 and M15 time frames may have more false entry points.
Open chart in a new window


