

Өзекті паттерндер

Прямоугольник
сформирован 27.03 в 22:46:39 (UTC+0)
сила сигнала 2 из 5
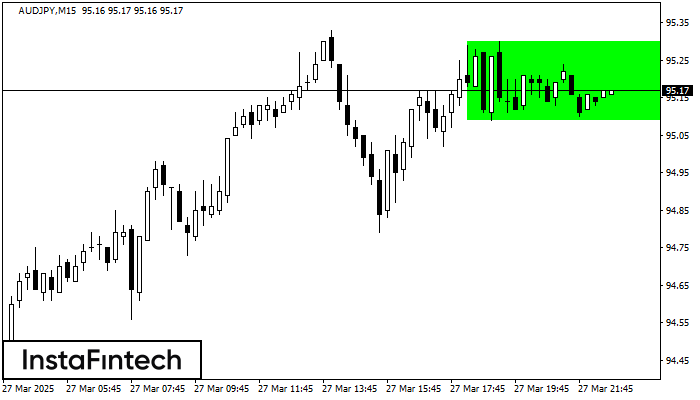
Сформирована фигура «Прямоугольник» на графике AUDJPY M15. Тип фигуры: Продолжение тренда; Границы: Верхняя 95.30, Нижняя 95.09; Сигнал: позицию на покупку следует открывать выше верхней границы прямоугольника 95.30.
Таймфреймы М5 и М15 могут иметь больше ложных точек входа.
Сондай-ақ қараңыз
- Все
- Все
- Bearish Rectangle
- Bearish Symmetrical Triangle
- Bearish Symmetrical Triangle
- Bullish Rectangle
- Double Top
- Double Top
- Triple Bottom
- Triple Bottom
- Triple Top
- Triple Top
- Все
- Все
- Покупка
- Продажа
- Все
- 1
- 2
- 3
- 4
- 5
বিয়ারিশ সিমেট্রিক্যাল ট্রায়াঙ্গেল
was formed on 09.05 at 12:20:11 (UTC+0)
signal strength 1 of 5
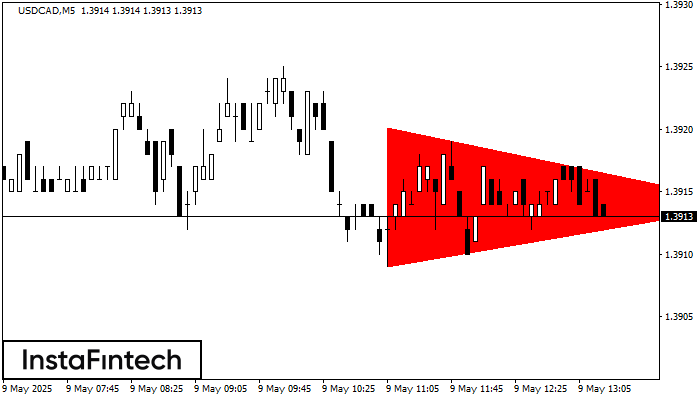
M5 চার্ট অনুযায়ী, USDCAD বিয়ারিশ সিমেট্রিক্যাল ট্রায়াঙ্গেল প্যাটার্ন গঠন করেছে। বর্ণনা: নীচের সীমানা হচ্ছে 1.3909/1.3914 এবং উপরের সীমানা হল 1.3920/1.3914৷ চার্টে প্যাটার্নের প্রস্থ -11 পিপস বলে পরিমাপ করা হয়েছে। বিয়ারিশ
M5 এবং M15 টাইম ফ্রেমে আরও ভুল এন্ট্রি পয়েন্ট থাকতে পারে।
Open chart in a new window
ট্রিপল টপ
was formed on 09.05 at 12:14:47 (UTC+0)
signal strength 2 of 5
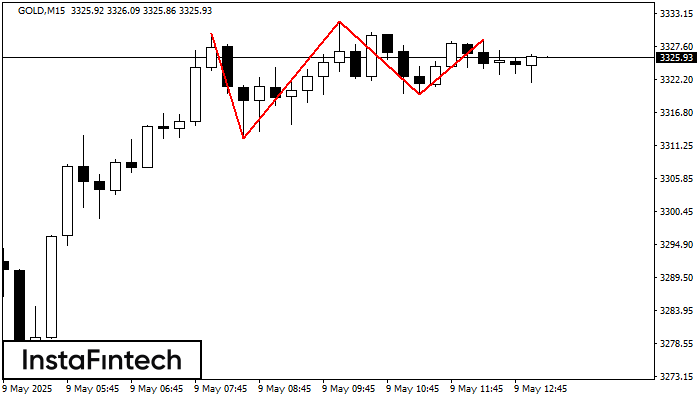
M15 চার্টে, GOLD ট্রেডিং ইন্সট্রুমেন্টের ট্রিপল টপ প্যাটার্ন প্রবণতা পরিবর্তনের ইঙ্গিত দেয়। তৃতীয় পিকের গঠনের পরে, মূল্য 3312.44-এর রেজিস্ট্যান্স স্তর ভেদ করার প্রচেষ্টা চালানোর সম্ভাবনা রয়েছে, এক্ষেত্রে আমরা সেল করার
M5 এবং M15 টাইম ফ্রেমে আরও ভুল এন্ট্রি পয়েন্ট থাকতে পারে।
Open chart in a new window
বুলিশ সিমেট্রিকাল ট্রায়াঙ্গেল
was formed on 09.05 at 12:11:48 (UTC+0)
signal strength 1 of 5
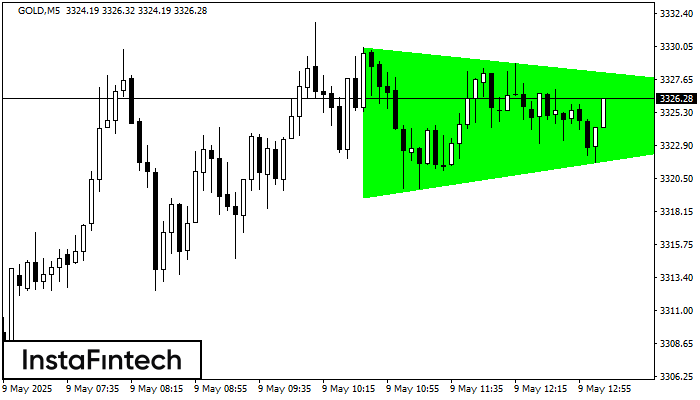
M5 চার্ট অনুসারে, GOLD বুলিশ সিমেট্রিকাল ট্রায়াঙ্গেল প্যাটার্ন গঠন করেছে, যা চলমান প্রবণতা অব্যাহত থাকবে বলে ইঙ্গিত দিচ্ছে। বর্ণনা: প্যাটার্নের উপরের সীমানা 3329.96/3325.57-এর কোঅর্ডিনেটগুলো স্পর্শ করেছে যেখানে নীচের সীমানা 3319.19/3325.57
M5 এবং M15 টাইম ফ্রেমে আরও ভুল এন্ট্রি পয়েন্ট থাকতে পারে।
Open chart in a new window


