

Өзекті паттерндер

Прямоугольник
сформирован 27.03 в 08:06:38 (UTC+0)
сила сигнала 1 из 5
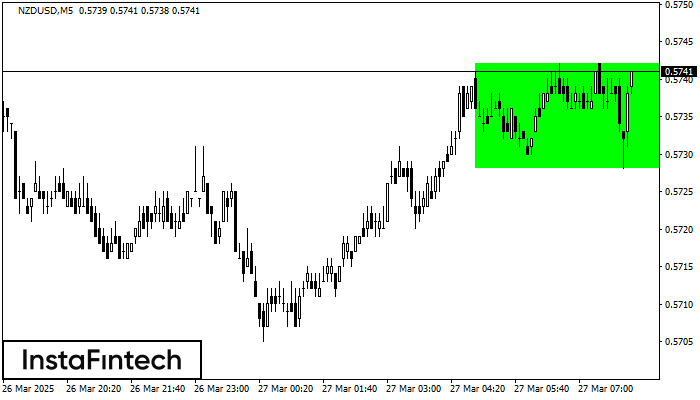
По торговому инструменту NZDUSD на M5 сформировалась фигура продолжения тренда - «Прямоугольник». Фигура имеет границы: Нижняя 0.5728; Верхняя 0.5742. В случае пробоя верхней границы вероятно дальнейшее движение в сторону тренда.
Таймфреймы М5 и М15 могут иметь больше ложных точек входа.
- Все
- Все
- Bearish Rectangle
- Bearish Symmetrical Triangle
- Bearish Symmetrical Triangle
- Bullish Rectangle
- Double Top
- Double Top
- Triple Bottom
- Triple Bottom
- Triple Top
- Triple Top
- Все
- Все
- Покупка
- Продажа
- Все
- 1
- 2
- 3
- 4
- 5
Bullish Rectangle
was formed on 09.05 at 22:57:29 (UTC+0)
signal strength 1 of 5

According to the chart of M5, GBPJPY formed the Bullish Rectangle. The pattern indicates a trend continuation. The upper border is 193.44, the lower border is 193.24. The signal means
The M5 and M15 time frames may have more false entry points.
Open chart in a new window
Triple Bottom
was formed on 09.05 at 22:35:52 (UTC+0)
signal strength 1 of 5

The Triple Bottom pattern has formed on the chart of the EURNZD M5 trading instrument. The pattern signals a change in the trend from downwards to upwards in the case
The M5 and M15 time frames may have more false entry points.
Open chart in a new window
Double Top
was formed on 09.05 at 22:30:52 (UTC+0)
signal strength 1 of 5

The Double Top reversal pattern has been formed on #Bitcoin M5. Characteristics: the upper boundary 103337.20; the lower boundary 102845.36; the width of the pattern is 51954 points. Sell trades
The M5 and M15 time frames may have more false entry points.
Open chart in a new window


