

Өзекті паттерндер

Прямоугольник
сформирован 26.03 в 14:44:13 (UTC+0)
сила сигнала 3 из 5
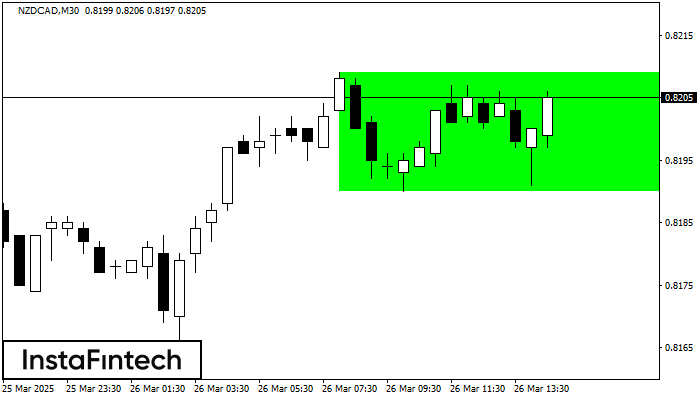
По торговому инструменту NZDCAD на M30 сформировалась фигура продолжения тренда - «Прямоугольник». Фигура имеет границы: Нижняя 0.8190; Верхняя 0.8209. В случае пробоя верхней границы вероятно дальнейшее движение в сторону тренда.
Сондай-ақ қараңыз
- Все
- Все
- Bearish Rectangle
- Bearish Symmetrical Triangle
- Bearish Symmetrical Triangle
- Bullish Rectangle
- Double Top
- Double Top
- Triple Bottom
- Triple Bottom
- Triple Top
- Triple Top
- Все
- Все
- Покупка
- Продажа
- Все
- 1
- 2
- 3
- 4
- 5
Double Bottom
сформирован 05.05 в 21:15:11 (UTC+0)
сила сигнала 2 из 5
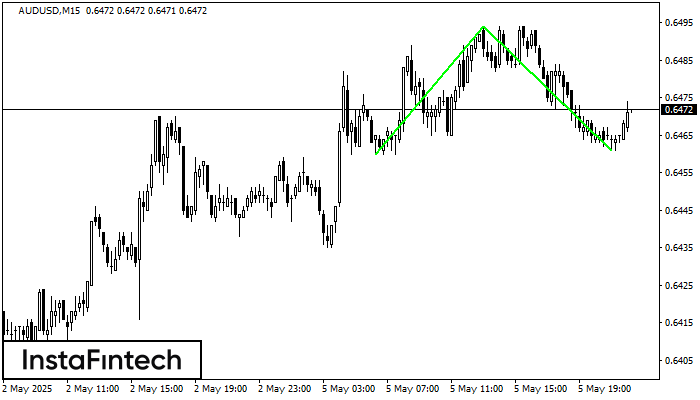
The Double Bottom pattern has been formed on AUDUSD M15; the upper boundary is 0.6494; the lower boundary is 0.6461. The width of the pattern is 34 points. In case
The M5 and M15 time frames may have more false entry points.
Открыть график инструмента в новом окне
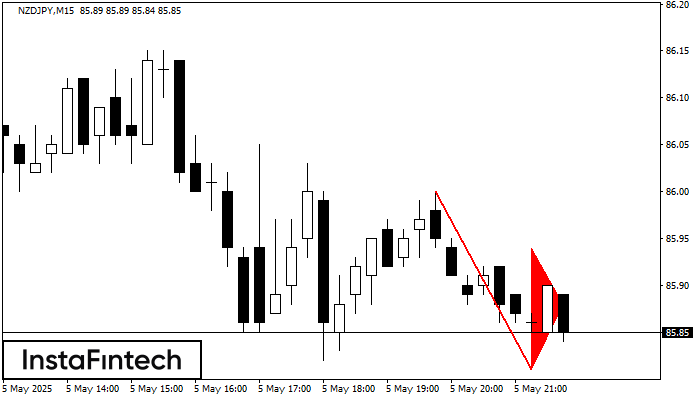
Bearish Flag
сформирован 05.05 в 20:52:49 (UTC+0)
сила сигнала 2 из 5
The Bearish Flag pattern has been formed on the chart NZDJPY M15. Therefore, the downwards trend is likely to continue in the nearest term. As soon as the price breaks
The M5 and M15 time frames may have more false entry points.
Открыть график инструмента в новом окне
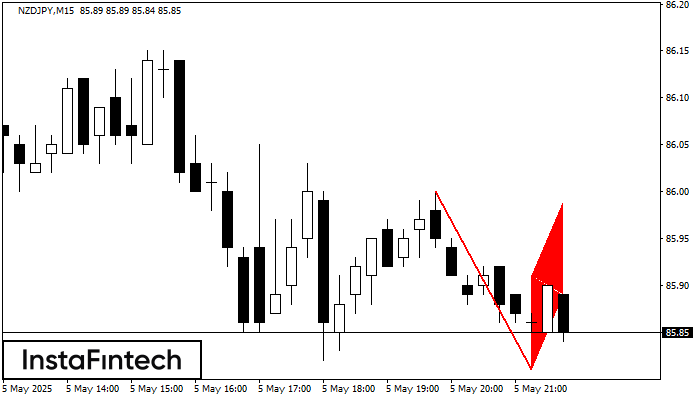
Bearish pennant
сформирован 05.05 в 20:52:44 (UTC+0)
сила сигнала 2 из 5
The Bearish pennant pattern has formed on the NZDJPY M15 chart. It signals potential continuation of the existing trend. Specifications: the pattern’s bottom has the coordinate of 85.81; the projection
The M5 and M15 time frames may have more false entry points.
Открыть график инструмента в новом окне


